


The Six Sigma quality improvement methodology has lasted for decades because it gets results. Companies in every country around the world, and in every industry, have used this logical, step-by-step method to improve the quality of their processes, products, and services. And they've saved billions of dollars along the way.
However, Six Sigma involves a good deal of statistics and data analysis, which makes many people uneasy. Individuals who are new to quality improvement often feel intimidated by the statistical aspects.
Don't be intimidated. Data analysis may be a critical component of improving quality, but the good news is that most of the analyses we use in Six Sigma aren't hard to understand, even if statistics isn't something you're comfortable with.
Just getting familiar with the tools used in Six Sigma is a good way to get started on your quality journey. In my last post, I offered a rundown of 5 tools that crop up in most Six Sigma projects. In this post, I'll review 5 more common statistical tools, and explain what they do and why they’re important in Six Sigma.
1. t-Tests
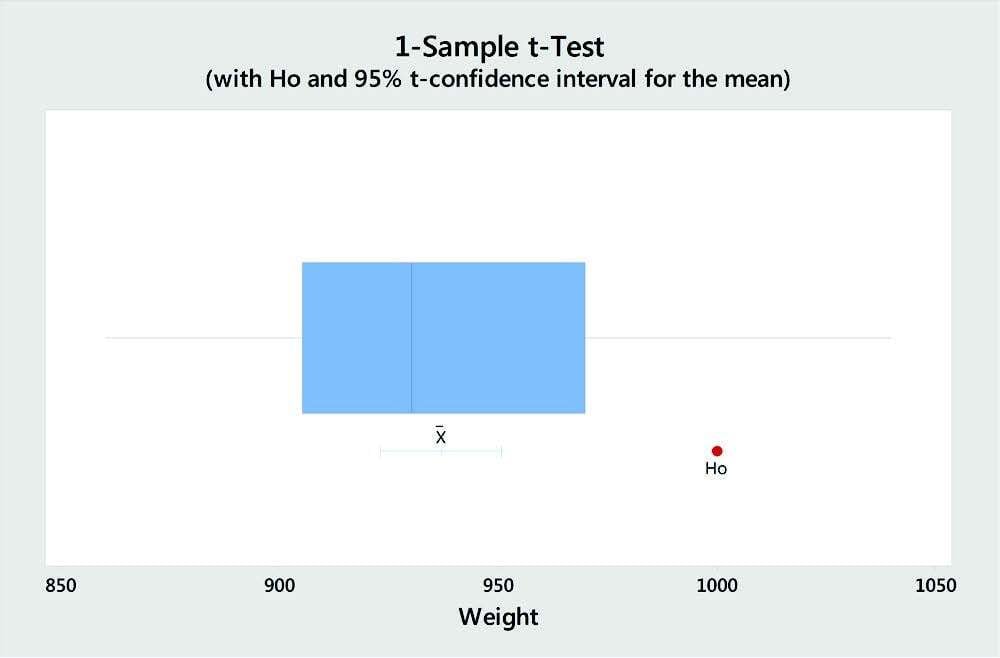
We use t-tests to compare the average of a sample to a target value, or to the average of another sample. For example, a company that sells beverages in 16-oz. containers can use a 1-sample t-test to determine if the production line’s average fill is on or off target. If you buy flavored syrup from two suppliers and want to determine if there’s a difference in the average volume of their respective shipments, you can use a 2-sample t-test to compare the two suppliers.
2. ANOVA
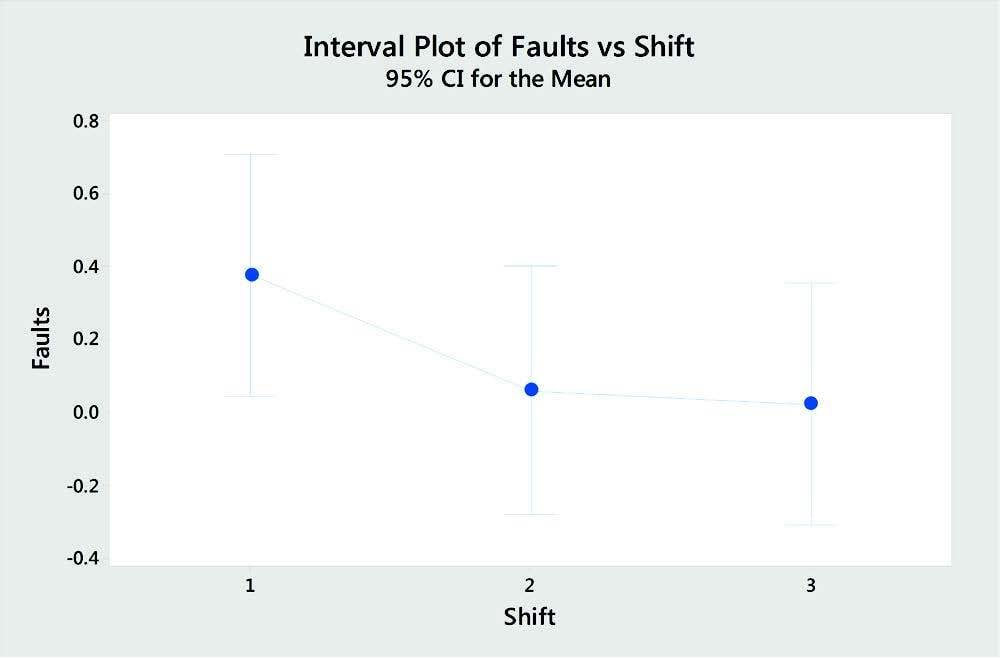
Where t-tests compare a mean to a target, or two means to each other, ANOVA—which is short for Analysis of Variance—lets you compare more than two means. For example, ANOVA can show you if average production volumes across 3 shifts are equal. You can also use ANOVA to analyze means for more than 1 variable. For example, you can simultaneously compare the means for 3 shifts and the means for 2 manufacturing locations.
3. Regression
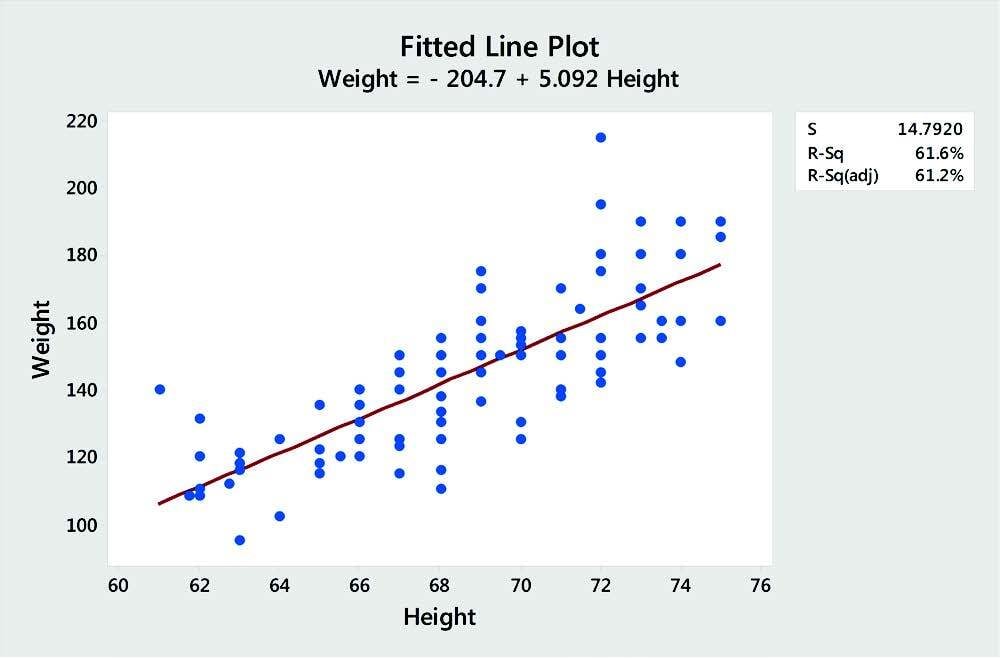
Regression helps you determine whether there's a relationship between an output and one or more input factors. For instance, you can use regression to examine if there is a relationship between a company’s marketing expenditures and its sales revenue. When a relationship between the variables exists, you can use the regression equation to describe that relationship and predict future output values for given input values.
4. DOE (Design of Experiments)
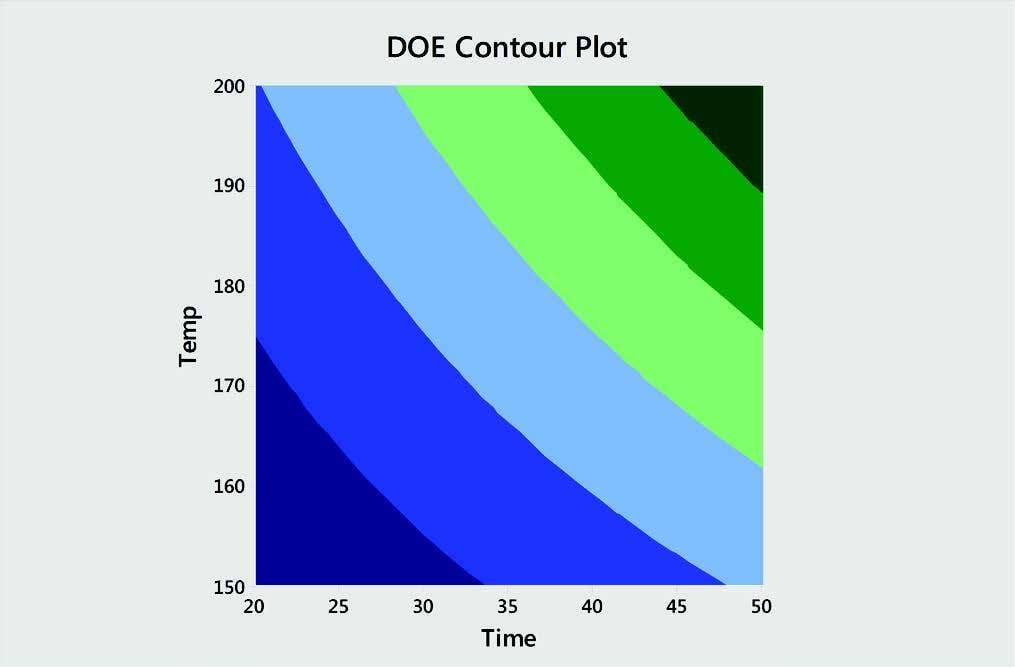
Regression and ANOVA are most often used for data that’s already been collected. In contrast, Design of Experiments (DOE) gives you an efficient strategy for collecting your data. It permits you to change or adjust multiple factors simultaneously to identify if relationships exist between inputs and outputs. Once you collect the data and identify the important inputs, you can then use DOE to determine the optimal settings for each factor.
5. Control Charts
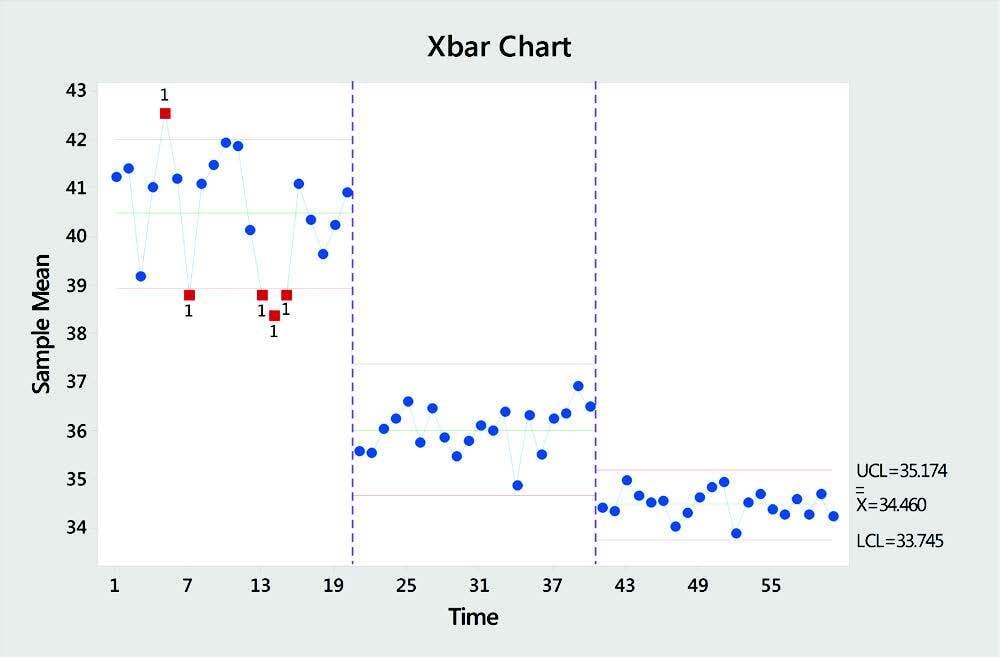
Every process has some natural, inherent variation, but a stable (and therefore predictable) process is a hallmark of quality products and services. It's important to know when a process goes beyond the normal, natural variation, because it can indicate a problem that needs to be resolved. A control chart distinguishes “special-cause” variation from acceptable, natural variation. These charts graph data over time and flag out-of-control data points, so you can detect unusual variability and take action when necessary. Control charts also help you ensure that you sustain process improvements into the future.
Conclusion
Any organization can benefit from Six Sigma projects, and those benefits are based on data analysis. However, many Six Sigma projects are completed by practitioners who are highly skilled, but not expert statisticians. But a basic understanding of common Six Sigma statistics, combined with easy-to-use statistical software, will let you handle these statistical tasks and analyze your data with confidence.