


Design of Experiments (DOE) has a reputation for difficulty, and to an extent, this statistical method deserves that reputation. While it's easy to grasp the basic idea—acquire the maximum amount of information from the fewest number of experimental runs—practical application of this tool can quickly become very confusing.
Even if you're a long-time user of designed experiments, it's still easy to feel uncertain if it's been a while since you last looked at split-plot designs or needed to choose the appropriate resolution for a fractional factorial design.But DOE is an extremely powerful and useful tool, so we added a DOE tool to the Assistant to make designed experiments more accessible to more people.
Since summer is here at Minitab's world headquarters, I'm going to illustrate how you can use the Assistant's DOE tool to optimize your grilling method.
If you're not already using it and you want to play along, you can download the free trial version of Minitab Statistical Software.
Two Types of Designed Experiments: Screening and Optimizing
To create a designed experiment using the Assistant, open Minitab and select Assistant > DOE > Plan and Create. You'll be presented with a decision tree that helps you take a sequential approach to the experimentation process by offering a choice between a screening design and a modeling design.
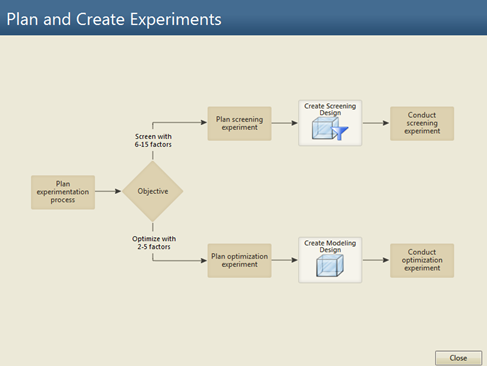
A screening design is important if you have a lot of potential factors to consider and you want to figure out which ones are important. The Assistant guides you through the process of testing and analyzing the main effects of 6 to 15 factors, and identifies the factors that have greatest influence on the response.
Once you've identified the critical factors, you can use the modeling design. Select this option, and the Assistant guides you through testing and analyzing 2 to 5 critical factors and helps you find optimal settings for your process.
Even if you're an old hand at analyzing designed experiments, you may want to use the Assistant to create designs since the Assistant lets you print out easy-to-use data collection forms for each experimental run. After you've collected and entered your data, the designs created in the Assistant can also be analyzed using Minitab's core DOE tools available through the Stat > DOE menu.
Creating a DOE to Optimize How We Grill Steaks
For grilling steaks, there aren't that many variables to consider, so we'll use the Assistant to plan and create a modeling design that will optimize our grilling process. Select Assistant > DOE > Plan and Create, then click the "Create Modeling Design" button.
Minitab brings up an easy-to-follow dialog box; all we need to do is fill it in.
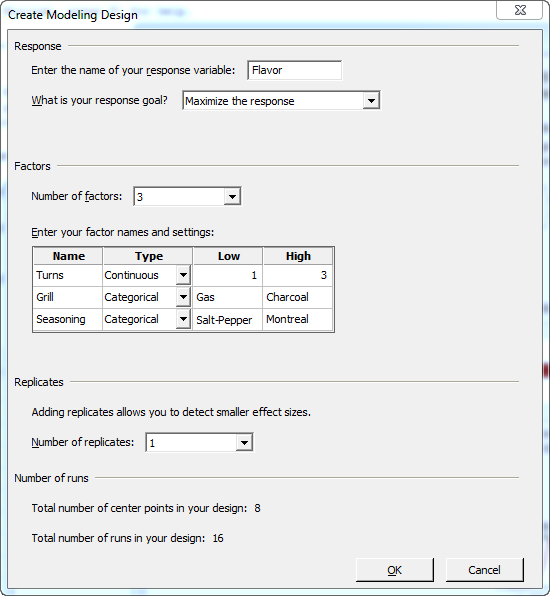
First we enter the name of our Response and the goal of the experiment. Our response is "Flavor," and the goal is "Maximize the response." Next, we enter our factors. We'll look at three critical variables:
- Number of turns, a continuous variable with a low value of 1 and high value of 3.
- Type of grill, a categorical variable with Gas or Charcoal as options.
- Type of seasoning, a categorical variable with Salt-Pepper or Montreal steak seasoning as options.
If we wanted to, we could select more than 1 replicate of the experiment. A replicate is simply a complete set of experimental runs, so if we did 3 replicates, we would repeat the full experiment three times. But since this experiment has 16 runs, and neither our budget nor our stomachs are limitless, we'll stick with a single replicate.
When we click OK, the Assistant first asks if we want to print out data collection forms for this experiment:
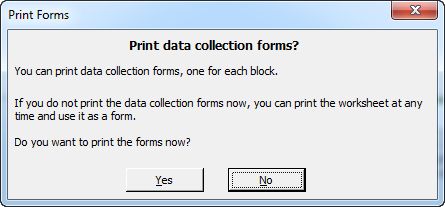
Choose Yes, and you can print a form that lists each run, the variables and settings, and a space to fill in the response:
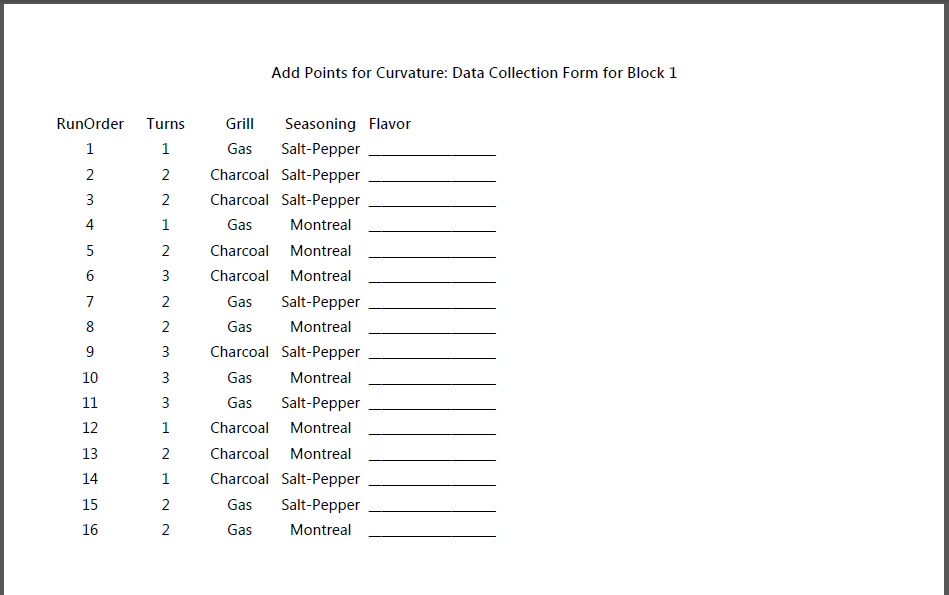
Alternatively, you can just record the results of each run in the worksheet the Assistant creates, which you'll need to do anyway. But having the printed data collection forms can make it much easier to keep track of where you are in the experiment, and exactly what your factor settings should be for each run.
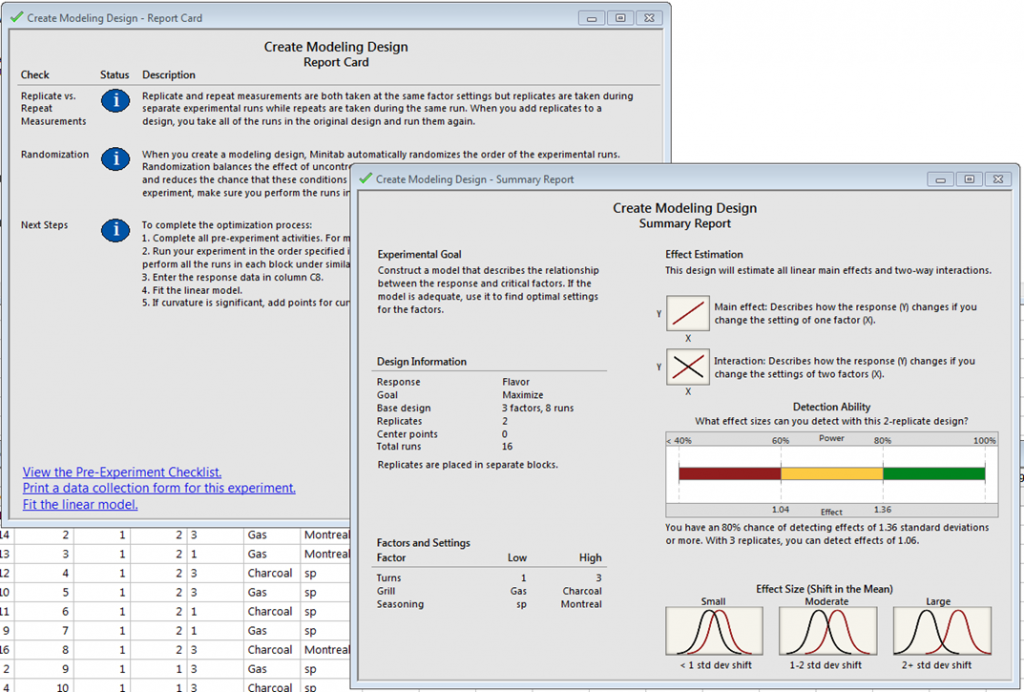
If you've used the Assistant in Minitab for other methods, you know that it seeks to demystify your analysis and make it easy to understand. When you create your experiment, the Assistant gives you a Report Card and Summary Report that explain the steps of the DOE and important considerations, and a summary of your goals and what your analysis will show.
Now it's time to cook some steaks, and rate the flavor of each. If you want to do this for real and collect your own data, please do so! Tomorrow's post will show how to analyze your data with the Assistant.