


Design of Experiments is an extremely powerful statistical method, and we added a DOE tool to the Assistant in Minitab to make it more accessible to more people.
Since it's summer grilling season, I'm applying the Assistant's DOE tool to outdoor cooking. Earlier, I showed you how to set up a designed experiment that will let you optimize how you grill steaks.
If you're not already using it and you want to play along, you can download the free 30-day trial version of Minitab Statistical Software.
Perhaps you are following along, and you've already grilled your steaks according to the experimental plan and recorded the results of your experimental runs. Otherwise, feel free to download my data here for the next step: analyzing the results of our experiment.
Analyzing the Results of the Steak Grilling Experiment
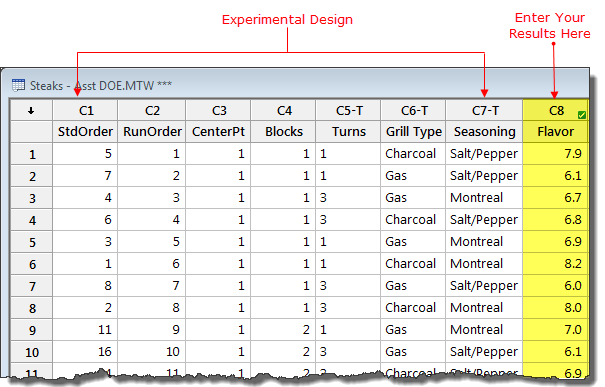
After collecting your data and entering it into Minitab, you should have an experimental worksheet that looks like this:
With your results entered in the worksheet, select Assistant > DOE > Analyze and Interpret. As you can see below, the only button you can click is "Fit Linear Model."
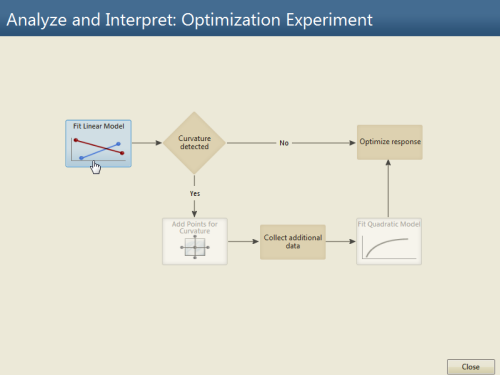
As you might gather from the flowchart, when it analyzes your data, the Assistant first checks to see if the response exhibits curvature. If it does, the Assistant will prompt you to gather more data so you it can fit a quadratic model. Otherwise, the Assistant will fit the linear model and provide the following output.
When you click the "Fit Linear Model" button, the Assistant automatically identifies your response variable.
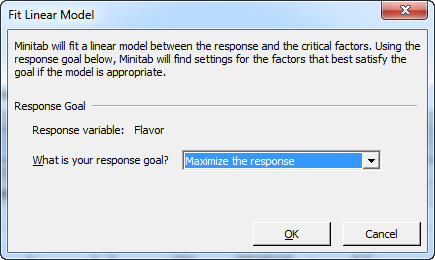
All you need to do is confirm your response goal—maximizing flavor, in this case—and press OK. The Assistant performs the analysis, and provides you the results in a series of easy-to-interpret reports.
Understanding the DOE Results
First, the Assistant offers a summary report that gives you the bottom-line results of the analysis. The Pareto Chart of Effects in the top left shows that Turns, Grill type, and Seasoning are all statistically significant, and there's a significant interaction between Turns and Grill type, too.
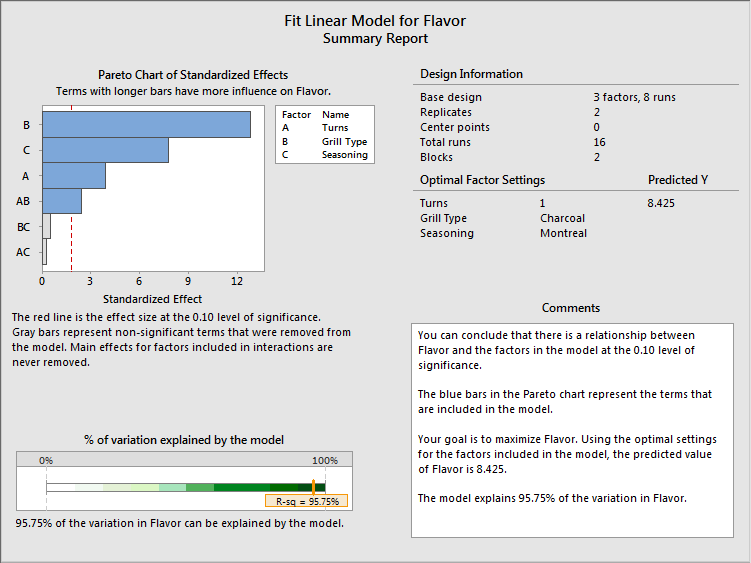
The summary report also shows that the model explains very high proportion of the variation in flavor, with an R2 value of 95.75 percent. And the "Comments" window in the lower right corner puts things if plain language: "You can conclude that there is a relationship between Flavor and the factors in the model..."
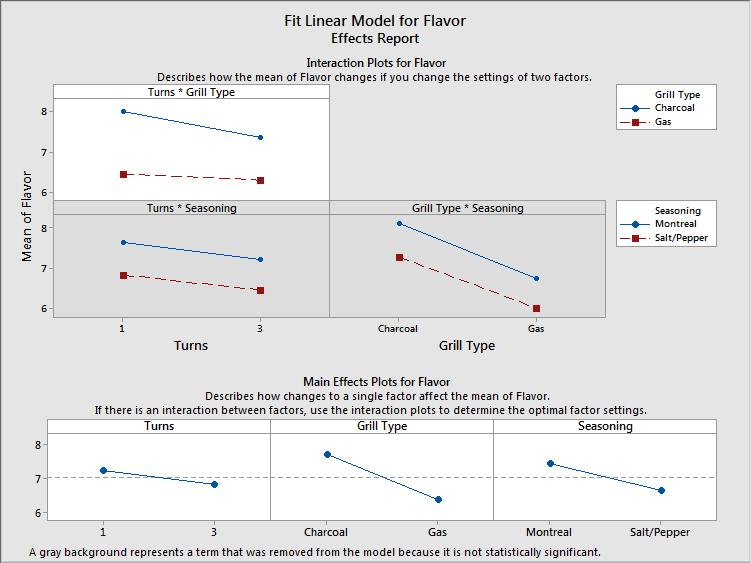
The Assistant's Effects report, shown below, tells you more about the nature of the relationship between the factors in the model and Flavor, with both Interaction Plots and Main Effects plots that illustrate how different experimental settings affect the Flavor response.
And if we're looking to make some changes as a result of our experimental results—like selecting an optimal method for grilling steaks in the future—the Prediction and Optimization report gives us the optimal solution (1 turn on a charcoal grill, with Montreal seasoning) and its predicted Flavor response (8.425).
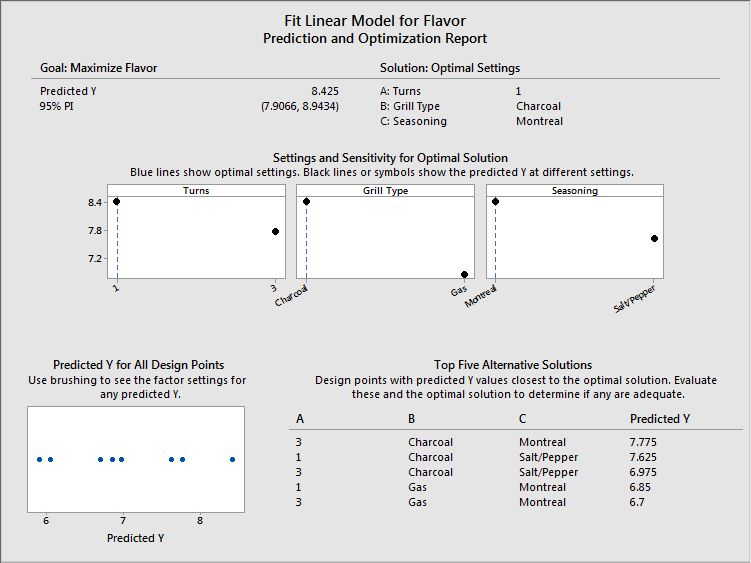
It also gives us the Top 5 alternative solutions, shown in the bottom right corner, so if there's some reason we can't implement the optimal solution—for instance, if we only have a gas grill—we can still choose the best solution that suits our circumstances.
I hope this example illustrates how easy a designed experiment can be when you use the Assistant to create and analyze it, and that designed experiments can be very useful not just in industry or the lab, but also in your everyday life.
Where could you benefit from analyzing process data to optimize your results?