


Have you ever wanted to know the odds of something happening, or not happening?
It's the kind of question that students are frequently asked to calculate by hand in introductory statistics classes, and going through that exercise is a good way to become familiar with the mathematical formulas the underlie probability (and hence, all of statistics).
But let's be honest: when class is over, most people don't take the time to calculate those probabilities—at least, not by hand. Some people even resort to "just making it up." Needless to say, we at Minitab are firmly opposed to just making it up.
The good news is that determining the real odds of something happening doesn't have to be hard work! If you don't want to calculate the probabilities by hand, just let a statistical software package such as Minitab do it for you.
Computing Binomial Probabilities
Let's look at how to compute binomial probabilities. The process we'll go through is similar for any of the 24 distributions Minitab includes.
We use the binomial distribution to characterize a process with two outcomes—for example, if a part passes or fails inspection, if a candidate wins or loses an election, or if a coin lands on heads or tails. This distribution is used frequently in quality control, opinion surveys, medical research, and insurance.
Suppose I want to know the probability of getting a certain number of heads in 10 tosses of a fair coin. I need to calculate the odds for a binomial distribution with 10 trials (n=10) and probability of success p=0.5.
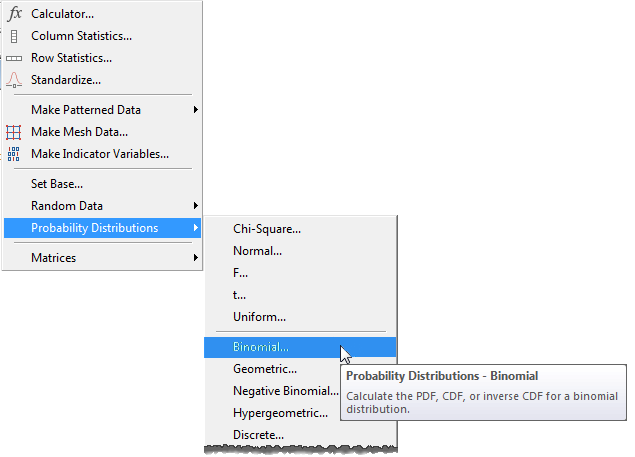
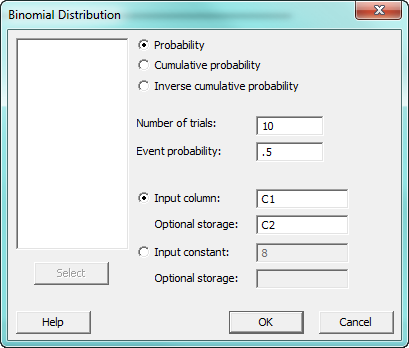
To compute the probability of exactly 8 successes, select Calc > Probability Distributions > Binomial...
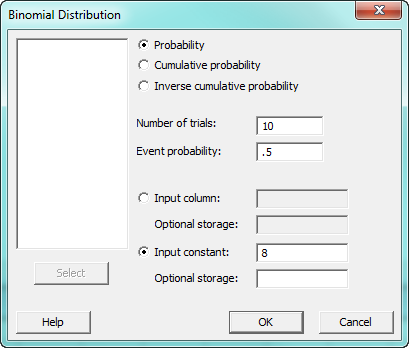
Choose “probability” in the dialog, then enter the number of trials (10) and the probability of success (0.5) for “event probability." If we wanted to calculate the odds for more than one number of events, we could enter them in a worksheet column. But since for now we just want the probability of getting exactly 8 heads in 10 tosses, choose the "Input Constant" option, enter 8, and press OK.
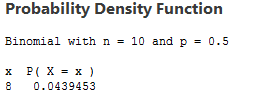
The following output appears in the session window. It tells us that if we toss a fair coin with an 50% probability of landing on heads, the odds of getting exactly 8 heads out of 10 tosses are just 4%.
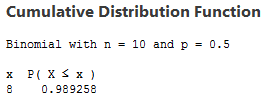
What if we wanted to know the cumulative probability of getting 8 heads in 10 tosses? Cumulative probability is the odds of one, two, or more events taking place. The word to remember is "or," because that's what cumulative probability tells you. What are the chances that when you toss this coin 10 times, you'll get 8 or fewer heads? That's cumulative probability.
To compute cumulative probabilities, select “cumulative probability” in the binomial distribution dialog.
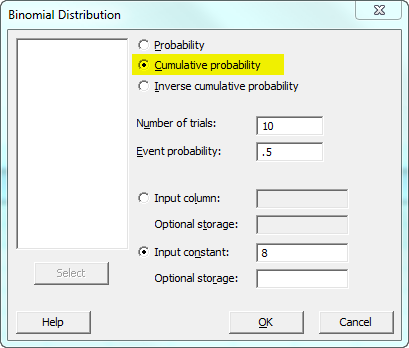
The probability of 8 or fewer successes, is P(X ≤ 8) = 0.989258, or 98%:
Creating a Table of Probabilities
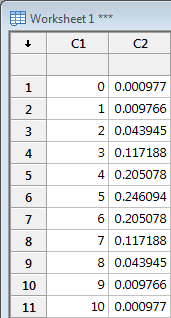
We can also use Minitab to calculate a full table of probabilities. In the worksheet, enter all of the values of the number of successes in a column. For example, for a series of 10 tosses, you would enter 1, 2, 3, 4, 5, 6, 7, 8, 9, 10. Next we'll select Calc > Probability Distributions > Binomial... again, but this time choose “Input column” and select C1 instead of using the "Input constant." Specify a different column for storage and press OK.
The probabilities appear in column C2:
Visualizing the Probabilities
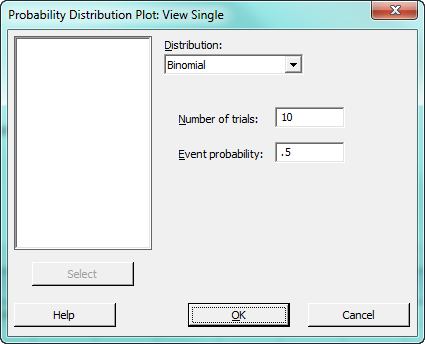
Suppose you want to see the distribution of these probabilities in a graph? Select Graph > Bar Charts..., then use the dialog box choose View Single.
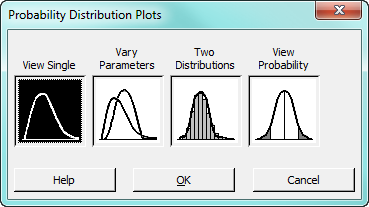
Just complete the dialog as shown:
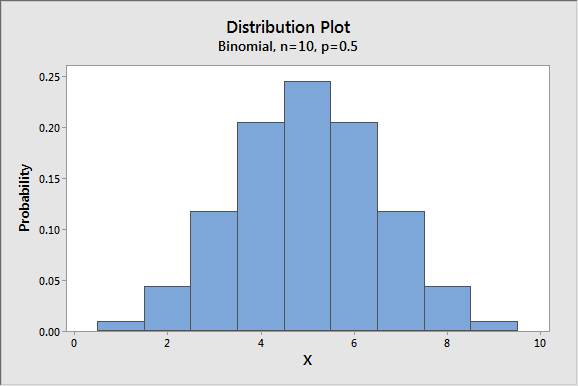
When you press OK, Minitab produces this bar chart:
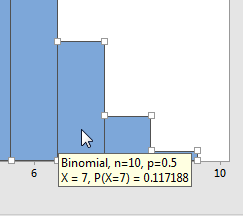
If you need to know the precise value for a given number of events, just hover over that column and Minitab displays the details:
As you can see, using Minitab to check and graph the probabilities of different events is not difficult. I hope knowing this increases the odds that the next time you wonder about the likelihood of an event, you'll be able to find it quickly and accurately!