


NOTE: This story will reveal how easy it can be to optimize settings using the statistical method called Design of Experiments, but it won't provide easy answers for making your own office coffee any better.
After her team’s ultimatum about the wretched office coffee, Jill used the design-of-experiments (DOE) tool in Minitab’s Assistant to design and analyze a screening study. Jill now knew that three of the factors she screened—the type of beans used, the number of cups brewed per pot, and the amount of grinding time the beans received—had a significant impact on the bitterness of coffee.
Now she needed to use those factors to make the coffee more palatable.
Designing an Experiment to Optimize Key Factors
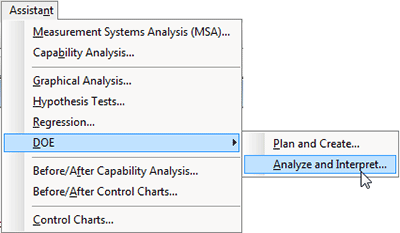
Once again, she turned to the Assistant’s DOE tool.
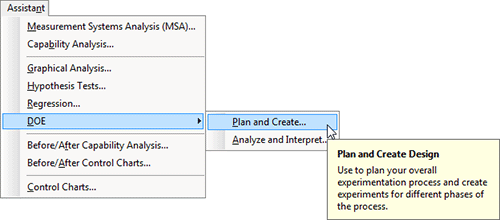
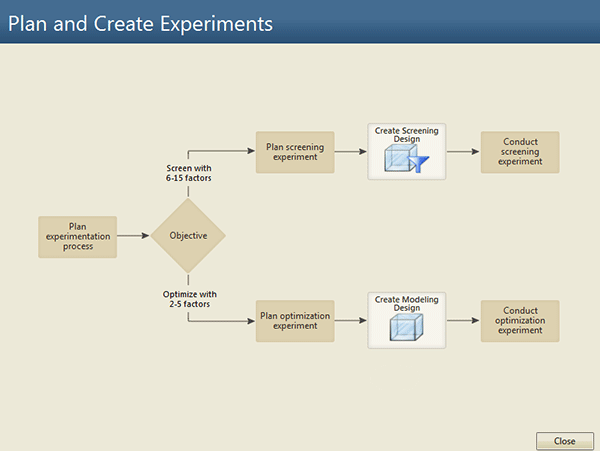
This time, she selected “Create Modeling Design” in the Assistant’s decision tree.
She completed the dialog box as shown:
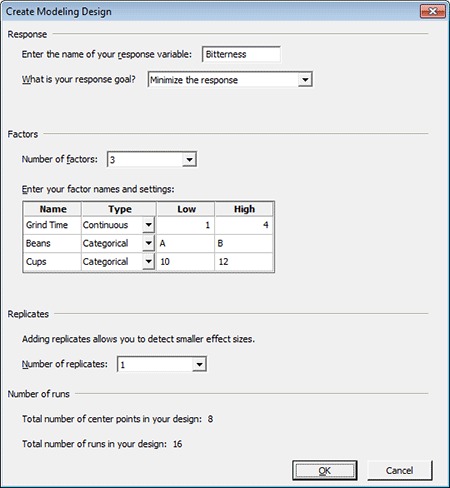
And the Assistant created a Minitab worksheet specifying the run order and variable settings for the experiment, and provided an option to print out sheets for data collection.
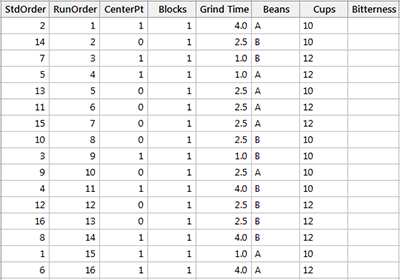
The experiment consisted of 16 runs, with each run being a pot of coffee prepared using varying combinations of factors. Jill asked all of the office’s coffee drinkers to sample and rate each brew. She then averaged all of the responses.
Analyzing the DOE Data for Optimization
Now it was time to analyze the data. After conducting the experiment and entering the data in the worksheet, Jill returned to the Assistant, this time to analyze the results:
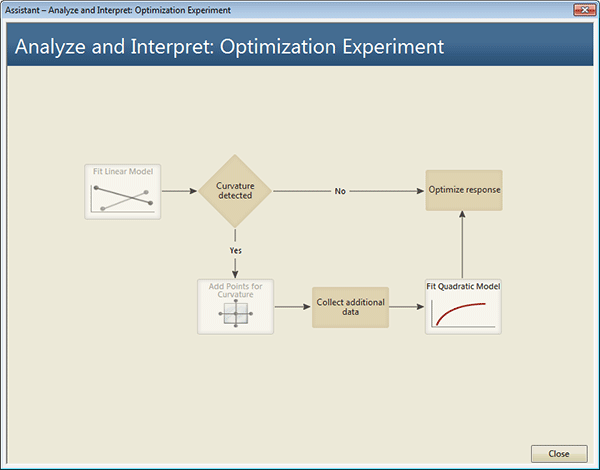
The Assistant presented a decision tree that offered various analysis options. But it very easy for Jill to select and press the “Fit Quadratic Model” button, because The Assistant—which automatically recognized the model structure of the experiment—disabled the buttons for “Fit Linear Model” (which would not be appropriate for this data) and “Add Points for Curvature” (which was unnecessary since the experimental structure already included those points).
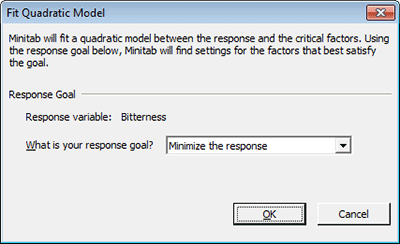
Before it could fit the model, the Assistant needed to know the goal: hitting a target, maximizing the response, or—as in this case—minimizing the response. Jill selected the appropriate option and clicked OK.
When Jill clicked OK, the Assistant analyzed the data and produced complete output for understanding the results. The Report Card confirmed the data met statistical assumptions, and the Diagnostic Report verified there were no unusual patterns in the results. The Effects Report illustrated the impacts of each factor, and the Summary Report clearly explained the bottom-line impact of the analysis.
Prediction and Optimization Report
But for Jill’s purposes, the most useful item was the Prediction and Optimization report, which detailed the optimal settings identified in the analysis, and also the top five alternative options, along with their predicted responses.
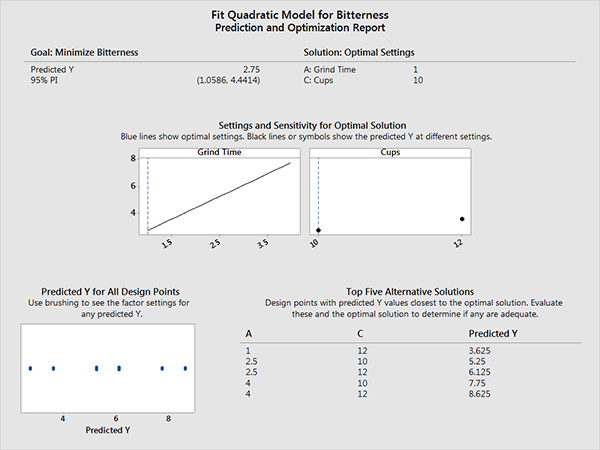
Based on the experiment’s results, Jill quickly wrote and posted new guidelines for preparing the office coffee. Steps 1 and 2 were:
- Grind the whole coffee beans only for 1 minute.
- Brew only 10 cups per pot of coffee.
Today, the office coffee may not rival the taste of that brewed by world-famous baristas, but it’s not so bad. And the cubicles no longer echo with sobbing and gagging sounds.
Both the brew and Jill’s sales team are a lot less bitter, thanks to an experiment designed and analyzed with the Minitab Assistant.