


Earlier this month, PLOS.org published an article titled "Ten Simple Rules for Effective Statistical Practice." The 10 rules are good reading for anyone who draws conclusions and makes decisions based on data, whether you're trying to extend the boundaries of scientific knowledge or make good decisions for your business.
Carnegie Mellon University's Robert E. Kass and several co-authors devised the rules in response to the increased pressure on scientists and researchers—many, if not most, of whom are not statisticians—to present accurate findings based on sound statistical methods.
Since the paper and the discussions it has prompted focus on scientists and researchers, it seems worthwhile to consider how the rules might apply to quality practitioners or business decision-makers as well. In this post, I'll share the 10 rules, some with a few modifications to make them more applicable to the wider population of all people who use data to inform their decisions.
1. Statistical Methods Should Enable Data to Answer Scientific Specific Questions
As the article points out, new or infrequent users of statistics tend to emphasize finding the "right" method to use—often focusing on the structure or format of their data, rather than thinking about how the data might answer an important question. But choosing a method based on the data is putting the cart before the horse. Instead, we should start by clearly identifying the question we're trying to answer. Then we can look for a method that uses the data to answer it. If you haven't already collected your data, so much the better—you have the opportunity to identify and obtain the data you'll need.
2. Signals Always Come With Noise
If you're familiar with control charts used in statistical process control (SPC) or the Control phase of a Six Sigma DMAIC project, you know that they let you distinguish process variation that matters (special-cause variation) from normal process variation that doesn't need investigation or correction.
Control charts are one common tool used to distinguish "noise" from "signal."
The same concept applies here: whenever we gather and analyze data, some of what we see in the results will be due to inherent variability. Measures of probability for analyses, such as confidence intervals, are important because they help us understand and account for this "noise."
3. Plan Ahead, Really Ahead
Say you're starting a DMAIC project. Carefully considering and developing good questions right at the start of a project—the DEFINE stage—will help you make sure that you're getting the right data in the MEASURE stage. That, in turn, should result in a much smoother and stress-free ANALYZE phase—and probably more successful IMPROVE and CONTROL phases, too. The alternative? You'll have to complete the ANALYZE phase with the data you have, not the data you wish you had.
4. Worry About Data Quality
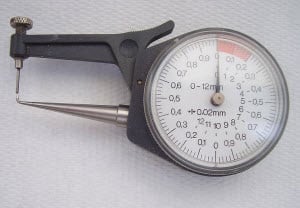 "Can you trust your data?" My Six Sigma instructor asked us that question so many times, it still flashes through my mind every time I open Minitab. That's good, because he was absolutely right: if you can't trust your data, you shouldn't do anything with it. Many people take it for granted that the data they get is precise and accurate, especially when using automated measuring instruments and similar technology. But how do you know they're measuring precisely and accurately? How do you know your instruments are calibrated properly? If you didn't test it, you don't know. And if you don't know, you can't trust your data. Fortunately, with measurement system analysis methods like gage R&R and attribute agreement analysis, we never have to trust data quality to blind faith.
5. Statistical Analysis Is More Than a Set of Computations
Statistical techniques are often referred to as "tools," and that's a very apt metaphor. A saw, a plane, and a router all cut wood, but they aren't interchangeable—the end product defines which tool is appropriate for a job. Similarly, you might apply ANOVA, regression, or time series analysis to the same data set, but the right tool depends on what you want to understand. To extend the metaphor further, just as we have circular saws, jigsaws, and miter saws for very specific tasks, each family of statistical methods also includes specialized tools designed to handle particular situations. The point is that we select a tool to assist our analysis, not to define it.
6. Keep it Simple
Many processes are inherently messy. If you've got dozens of input variables and multiple outcomes, analyzing them could require many steps, transformations, and some thorny calculations. Sometimes that degree of complexity is required. But a more complicated analysis isn't always better—in fact, overcomplicating it may make your results less clear and less reliable. It also potenitally makes the analysis more difficult than necessary. You may not need a complex process model that includes 15 factors if you can improve your output by optimizing the three or four most important inputs. If you need to improve a process that includes many inputs, a short screening experiment can help you identify which factors are most critical, and which are not so important.
7. Provide Assessments of Variability
No model is perfect. No analysis accounts for all of the observed variation. Every analysis includes a degree of uncertainty. Thus, no statistical finding is 100% certain, and that degree of uncertainty needs to be considered when using statistical results to make decisions. If you're the decision-maker, be sure that you understand the risks of reaching a wrong conclusion based on the analysis at hand. If you're sharing your results with stakeholders and executives, especially if they aren't statistically inclined, make sure you've communicated that degree of risk to them by offering and explaining confidence intervals, margins of error, or other appropriate measures of uncertainty.
8. Check Your Assumptions
Different statistical methods are based on different assumptions about the data being analyzed. For instance, many common analyses assume that your data follow a normal distribution. You can check most of these assumptions very quickly using functions like a normality test in your statistical software, but it's easy to forget (or ignore) these steps and dive right into your analysis. However, failing to verify those assumptions can yield results that aren't reliable and shouldn't be used to inform decisions, so don't skip that step. If you're not sure about the assumptions for a statistical analysis, Minitab's Assistant menu explains them, and can even flag violations of the assumptions before you draw the wrong conclusion from an errant analysis.
9. When Possible, Replicate Verify Success!
In science, replication of a study—ideally by another, independent scientist—is crucial. It indicates that the first researcher's findings weren't a fluke, and provides more evidence in support of the given hypothesis. Similarly, when a quality project results in great improvements, we can't take it for granted those benefits are going to be sustained—they need to be verified and confirmed over time. Control charts are probably the most common tool for making sure a project's benefits endure, but depending on the process and the nature of the improvements, hypothesis tests, capability analysis, and other methods also can come into play.
10. Make Your Analysis Reproducible Share How You Did It
In the original 10 Simple Rules article, the authors suggest scientists share their data and explain how they analyzed it so that others can make sure they get the same results. This idea doesn't translate so neatly to the business world, where your data may be proprietary or private for other reasons. But just as science benefits from transparency, the quality profession benefits when we share as much information as we can about our successes. Of course you can't share your company's secret-sauce formulas with competitors—but if you solved a quality challenge in your organization, chances are your experience could help someone facing a similar problem. If a peer in another organization already solved a problem like the one you're struggling with now, wouldn't you like to see if a similar approach might work for you? Organizations like ASQ and forums like iSixSigma.com help quality practitioners network and share their successes so we can all get better at what we do. And here at Minitab, we love sharing case studies and examples of how people have solved problems using data analysis, too.
How do you think these rules apply to the world of quality and business decision-making? What are your guidelines when it comes to analyzing data?