


Earlier, I wrote about the different types of data statisticians typically encounter. In this post, we're going to look at why, when given a choice in the matter, we prefer to analyze continuous data rather than categorical/attribute or discrete data.
As a reminder, when we assign something to a group or give it a name, we have created attribute or categorical data. If we count something, like defects, we have gathered discrete data. And if we can measure something to a (theoretically) infinite degree, we have continuous data.
Or, to put in bullet points:
- Categorical = naming or grouping data
- Discrete = count data
- Continuous = measurement data
A statistical software package like Minitab is extremely powerful and can tell us many valuable things—as long as we're able to feed it good numbers. Without numbers, we have no analyses nor graphs. Even categorical or attribute data needs to be converted into numeric form by counting before we can analyze it.
What Makes Numeric Data Discrete or Continuous?
At this point, you may be thinking, "Wait a minute—we can't really measure anything infinitely,so isn't measurement data actually discrete, too?" That's a fair question.
If you're a strict literalist, the answer is "yes"—when we measure a property that's continuous, like height or distance, we are de facto making a discrete assessment. When we collect a lot of those discrete measurements, it's the amount of detail they contain that will dictate whether we can treat the collection as discrete or continuous.
I like to think of it as a question of scale. Say I want to measure the weight of 16-ounce cereal boxes coming off a production line, and I want to be sure that the weight of each box is at least 16 ounces, but no more than 1/2 ounce over that.
With a scale calibrated to whole pounds, all I can do is put every box into one of three categories: less than a pound, 1 pound, or more than a pound.
With a scale that can distinguish ounces, I will be able to measure with a bit more accuracy just how close to a pound the individual boxes are. I'm getting nearer to continuous data, but there are still only 16 degrees between each pound.
But if I measure with a scale capable of distinguishing 1/1000th of an ounce, I will have quite a wide scale—a continuum—of potential values between pounds. The individual boxes could have any value between 0.000 and 1.999 pounds. The scale of these measurements is fine enough to be analyzed with powerful statistical tools made for continuous data.
What Can I Do with Continuous Data that I Can't Do with Discrete?
Not all data points are equally valuable, and you can glean a lot more insight from 100 points of continuous data than you can from 100 points of attribute or count data. How does this finer degree of detail affect what we can learn from a set of data? It's easy to see.
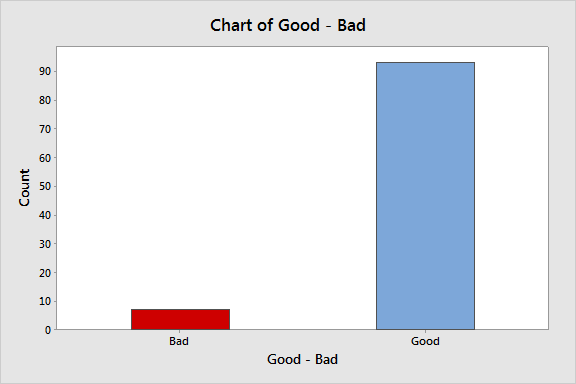
Let's start with the simplest kind of data, attribute data that rates a the weight of a cereal box as good or bad. For 100 boxes of cereal, any that are under 1 pound are classified as bad, so each box can have one of only two values.
We can create a bar chart or a pie chart to visualize this data, and that's about it:
If we bump up the precision of our scale to differentiate between boxes that are over and under 1 pound, we can put each box of cereal into one of three categories. Here's what that looks like in a pie chart:
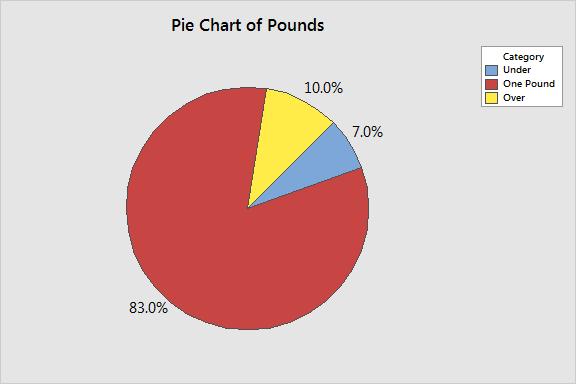
This gives us a little bit more insight—we now see that we are overfilling more boxes than we are underfilling—but there is still a very limited amount of information we can extract from the data.
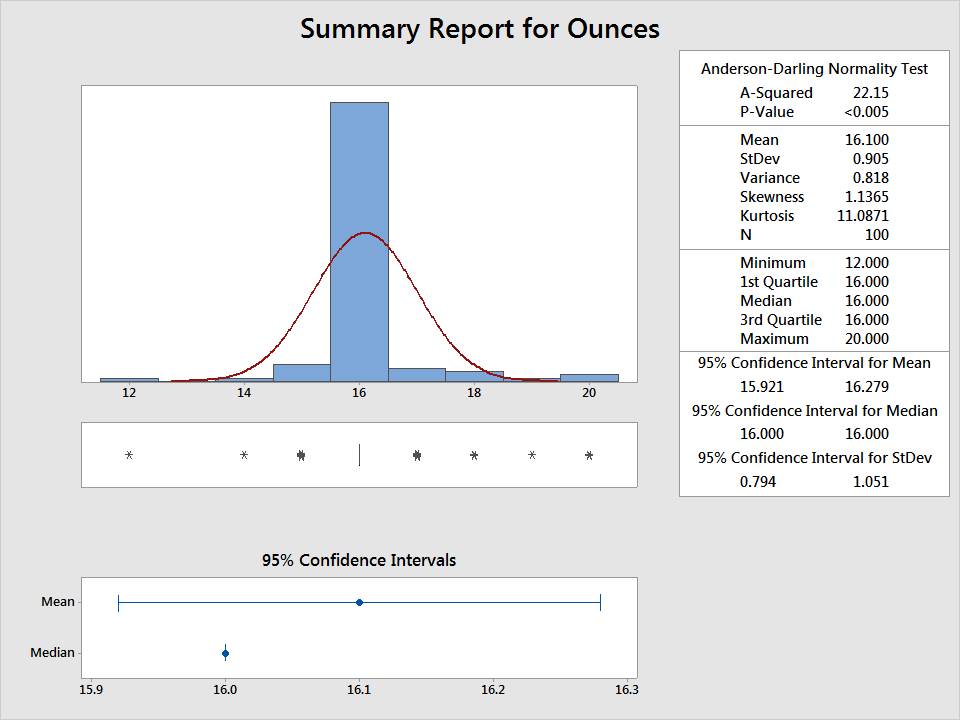
If we measure each box to the nearest ounce, we open the door to using methods for continuous data, and get a still better picture of what's going on. We can see that, on average, the boxes weigh 1 pound. But there's high variability, with a standard deviation of 0.9. There's also a wide range in our data, with observed values from 12 to 20 ounces:
If I measure the boxes with a scale capable of differentiating thousandths of an ounce, more options for analysis open up. For example, now that the data are fine enough to distinguish half-ounces (and then some), I can perform a capability analysis to see if my process is even capable of consistently delivering boxes that fall between 16 and 16.5 ounces. I'll use the Assistant in Minitab to do it, selecting Assistant > Capability Analysis:
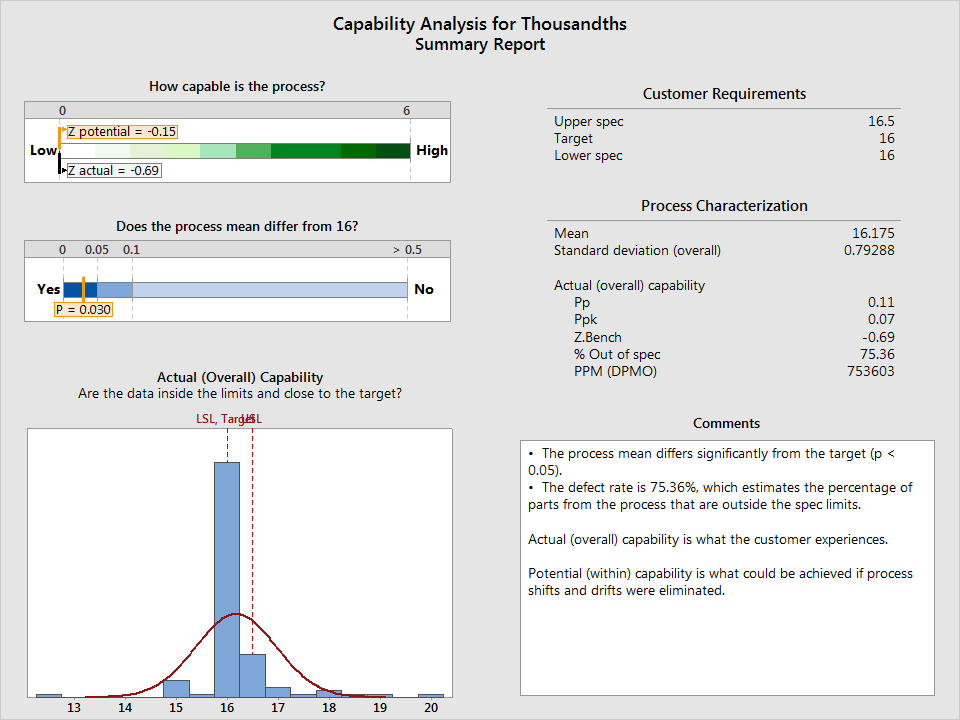
The analysis has revealed that my process isn't capable of meeting specifications. Looks like I have some work to do...but the Assistant also gives me an I-MR control chart, which reveals where and when my process is going out of spec, so I can start looking for root causes.
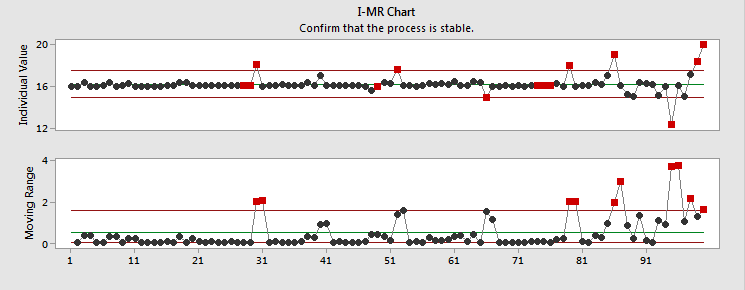
If I were only looking at attribute data, I might think my process was just fine. Continuous data has allowed me to see that I can make the process better, and given me a rough idea where to start. By making changes and collecting additional continuous data, I'll be able to conduct hypothesis tests, analyze sources of variances, and more.
Some Final Advantages of Continuous Over Discrete Data
Does this mean discrete data is no good at all? Of course not—we are concerned with many things that can't be measured effectively except through discrete data, such as opinions and demographics. But when you can get it, continuous data is the better option. The table below lays out the reasons why.
| Continuous Data |
Discrete Data |
| Inferences can be made with few data points—valid analysis can be performed with small samples. | More data points (a larger sample) needed to make an equivalent inference. |
| Smaller samples are usually less expensive to gather | Larger samples are usually more expensive to gather. |
| High sensitivity (how close to or far from a target) | Low sensitivity (good/bad, pass/fail) |
| Variety of analysis options that can offer insight into the sources of variation | Limited options for analysis, with little indication of sources of variation |
I hope this very basic overview has effectively illustrated why you should opt for continuous data over discrete data whenever you can get it.
For more information, check out our training options.