---
title: How to Estimate the Probability of a No-Show using Binary Logistic Regression
description: How to Estimate the Probability of a No-Show using Binary Logistic Regression
image: https://blog.minitab.com/hubfs/B2BML%20-%20NEW%20FILE%20MANAGER%20STRUCTURE/Blog%20Images/Imported_Blog_Media/aircraft_jet_landing_cloud_46148.jpg
---
English
- [English](https://blog.minitab.com/en/?hsLang=en)
- [Français](https://blog.minitab.com/fr/?hsLang=en)
- [Deutsch](https://blog.minitab.com/de/?hsLang=en)
- [Português](https://blog.minitab.com/pt/?hsLang=en)
- [Español](https://blog.minitab.com/es/?hsLang=en)
- [日本語](https://blog.minitab.com/ja/?hsLang=en)
- [한국어](https://blog.minitab.com/ko/?hsLang=en)
- [中文(简体)](https://blog.minitab.com/zh/?hsLang=en)
- [ Partners](https://www.minitab.com/en-us/company/partners/)
- [ Contact](https://www.minitab.com/en-us/company/contact-us/)
- [ Talk to Minitab](https://www.minitab.com/en-us/talk-to-minitab/)
- [ My Account](https://licensing.minitab.com/account/manage)
[](https://www.minitab.com/en-us/)
- Products
Back
[Products](https://www.minitab.com/en-us/products/)
[All Products](https://www.minitab.com/en-us/products/)
- [Minitab Solution Center](https://www.minitab.com/en-us/products/minitab-solution-center/)
- [Minitab Statistical Software](https://www.minitab.com/en-us/products/minitab/)
- [Minitab Connect](https://www.minitab.com/en-us/products/connect/)
- [Minitab Model Ops](https://www.minitab.com/en-us/products/model-ops/)
- [Minitab Education Hub](https://www.minitab.com/en-us/products/education-hub/)
- [Minitab Engage](https://www.minitab.com/en-us/products/engage/)
- [Minitab Workspace](https://www.minitab.com/en-us/products/workspace/)
- [Real-Time SPC](https://www.minitab.com/en-us/products/real-time-spc/)
- [Prolink Data Collection & SPC](https://www.minitab.com/en-us/products/prolink)
- [Simul8 Discrete Event Simulation](https://info.minitab.com/en/new-to-simul8?hsLang=en)
- [SPM](https://www.minitab.com/en-us/products/spm/)
- Solutions
Back
[Solutions](https://www.minitab.com/en-us/solutions/)
[All Solutions](https://www.minitab.com/en-us/solutions/)
- [Analytics](https://www.minitab.com/en-us/solutions/analytics/)
- [Statistics & Predictive Analytics](https://www.minitab.com/en-us/solutions/analytics/statistical-analysis-predictive-analytics/)
- [Data Science & Machine Learning](https://www.minitab.com/en-us/solutions/analytics/data-science-machine-learning/)
- [Business Analytics & Intelligence](https://www.minitab.com/en-us/solutions/analytics/business-analytics-intelligence/)
- [Statistical Process Control](https://www.minitab.com/en-us/solutions/analytics/statistical-process-control/)
- [Quality Analytics](https://www.minitab.com/en-us/solutions/analytics/quality-analytics/)
- [Live Analytics](https://www.minitab.com/en-us/solutions/analytics/live-analytics/)
- [Reliability & Life Data Analysis](https://www.minitab.com/en-us/solutions/analytics/reliability/)
- [Discrete Event Simulation](https://info.minitab.com/en/new-to-simul8?hsLang=en)
- [Process Mining](https://info.minitab.com/en/new-to-simul8?hsLang=en)
- [Key Capabilities](https://www.minitab.com/en-us/solutions/key-capabilities/)
- [Continuous Improvement](https://www.minitab.com/en-us/solutions/key-capabilities/continuous-improvement/)
- [Data Integration & Data Prep](https://www.minitab.com/en-us/solutions/key-capabilities/data-integration-data-prep/)
- [Diagramming & Mind Mapping](https://www.minitab.com/en-us/solutions/key-capabilities/diagramming-mind-mapping/)
- [Digital Twins](https://info.minitab.com/en/new-to-simul8?hsLang=en)
- [Model Deployment & ML Ops](https://www.minitab.com/en-us/solutions/key-capabilities/model-deployment-ml-ops/)
- [Innovation & Project Management](https://www.minitab.com/en-us/solutions/key-capabilities/innovation-project-management/)
- [Process Excellence: Detect, Correct & Prevent](https://www.minitab.com/en-us/solutions/key-capabilities/process-excellence/)
- [Featured Industries](https://www.minitab.com/en-us/solutions/industry/)
- [Academic](https://www.minitab.com/en-us/solutions/industry/academic/)
- [Energy & Natural Resources](https://www.minitab.com/en-us/solutions/industry/energy-resources/)
- [Government & Public Sector](https://www.minitab.com/en-us/solutions/industry/government/)
- [Healthcare](https://www.minitab.com/en-us/solutions/industry/healthcare/)
- [Insurance](https://www.minitab.com/en-us/solutions/industry/insurance/)
- [Manufacturing & Industrial](https://www.minitab.com/en-us/solutions/industry/manufacturing-industrial/)
- [Services](https://www.minitab.com/en-us/solutions/industry/service-industries/)
- [Software & Technology](https://www.minitab.com/en-us/solutions/industry/software-technology/)
- [Construction](https://www.minitab.com/en-us/solutions/industry/construction/)
- [Featured Roles](https://www.minitab.com/en-us/solutions/role/)
- [Engineering](https://www.minitab.com/en-us/solutions/role/engineering/)
- [Business Analysis](https://www.minitab.com/en-us/solutions/role/business-analysts/)
- [Information Technology](https://www.minitab.com/en-us/solutions/role/information-technology/)
- [Supply Chain](https://www.minitab.com/en-us/solutions/role/supply-chain/)
- [Customer Service & Contact Center](https://www.minitab.com/en-us/solutions/role/customer-service-contact-center/)
- [Human Resources](https://www.minitab.com/en-us/solutions/role/human-resources/)
- [Marketing](https://www.minitab.com/en-us/solutions/role/marketing/)
- [Research and Development](https://www.minitab.com/en-us/solutions/role/research-and-development/)
- Resources & Services
Back
[Resources & Services](https://www.minitab.com/en-us/resources-services/)
[All Resources & Services](https://www.minitab.com/en-us/resources-services/)
- [Resources](https://www.minitab.com/en-us/resources-services/resources/)
- [Case Studies](https://www.minitab.com/en-us/resources-services/resources/case-studies/)
- [eBooks & White Papers](https://www.minitab.com/en-us/resources-services/resources/ebooks-and-white-papers/)
- [Blog](https://blog.minitab.com/blog/?hsLang=en)
- [Data Sets](https://www.minitab.com/en-us/resources-services/resources/data-set/)
- [Webinars & Events](https://www.minitab.com/en-us/resources-services/resources/events/)
- [Education Hub](https://www.minitab.com/en-us/resources-services/resources/education-hub/)
- [Services](https://www.minitab.com/en-us/resources-services/services/)
- [Training](https://www.minitab.com/en-us/resources-services/services/training/)
- [Deployment](https://www.minitab.com/en-us/resources-services/services/deployment/)
- [Consulting](https://www.minitab.com/en-us/resources-services/services/statistical-consulting/)
- [Self-Paced Learning](https://www.minitab.com/en-us/resources-services/services/self-paced-learning/)
- [Continuing Education](https://www.minitab.com/en-us/resources-services/services/continuing-education/)
- Support
Back
[Support](https://www.minitab.com/en-us/support/)
[Technical Support](https://www.minitab.com/en-us/support/)
- [Subscriptions & Activation](https://www.minitab.com/en-us/support/subscriptions-and-activation/)
- [Minitab Quick Start](https://www.minitab.com/en-us/support/quick-start/)
- [Training](https://www.minitab.com/en-us/resources-services/services/training/)
- [Installation Support](https://www.minitab.com/en-us/support/installation/)
- [Support Videos](https://www.minitab.com/en-us/support/videos/)
- [Support Documentation](https://www.minitab.com/en-us/support/documents/)
- [Software Updates](https://www.minitab.com/en-us/support/software-updates/)
- [Product Downloads](https://www.minitab.com/en-us/support/downloads/)
- [Support Policy](https://www.minitab.com/en-us/support/policy/)
- Company
Back
[Company](https://www.minitab.com/en-us/company/)
[Company](https://www.minitab.com/en-us/company/)
- [About Us](https://www.minitab.com/en-us/company/our-company/)
- [Leadership Team](https://www.minitab.com/en-us/company/leadership-team/)
- [Partners](https://www.minitab.com/en-us/company/partners/)
- [Careers](https://www.minitab.com/en-us/company/careers/)
- [Contact](https://www.minitab.com/en-us/company/contact-us/)
- [News](https://www.minitab.com/en-us/company/press-releases/)
[Try/Buy](https://www.minitab.com/en-us/try-buy/)
- [Statistics](https://blog.minitab.com/en/blog/tag/statistics)
- [Data Analysis](https://blog.minitab.com/en/blog/tag/data-analysis)
-
- [Quality Improvement](https://blog.minitab.com/en/blog/tag/quality-improvement)
- [Subscribe](https://info.minitab.com/blog/subscribe?hsLang=en)

## Notice
You are now leaving minitab.com.
Click Continue to proceed to:
Continue
Go Back
# How to Estimate the Probability of a No-Show using Binary Logistic Regression
Minitab Blog Editor | 8/3/2017
Topics: [Regression Analysis](https://blog.minitab.com/en/blog/tag/regression-analysis)
- [Share](https://www.linkedin.com/shareArticle?mini=true&url=https://blog.minitab.com/en/blog/using-data-and-statistics/how-to-estimate-the-probability-of-a-no-show-using-binary-logistic-regression)
- [Share](https://www.facebook.com/sharer.php?u=https://blog.minitab.com/en/blog/using-data-and-statistics/how-to-estimate-the-probability-of-a-no-show-using-binary-logistic-regression)
In April 2017, overbooking of flight seats hit the headlines when a United Airlines customer was dragged off a flight. A TED talk by Nina Klietsch gives a good, but simplistic explanation of why overbooking is so attractive to airlines.
Overbooking is not new to the airlines; these strategies were officially sanctioned by The American Civil Aeronautics Board in 1965, and since that time complex statistical models have been researched and developed to set the ticket pricing and overbooking strategies to deliver maximum revenue to the airlines.
In this blog, I would like to look at one aspect of this: the probability of a no-show. In Klietsch’s talk, she assumed that the probability of a no-show (a customer not turning up for a flight) is identical for all customers. In reality, this is not true—factors such as time of day, price, time since booking, and whether a traveler is alone or in a group will impact the probability of a no show.
By using this information about our customers, we can predict the probability of a no-show using [binary logistic regression](https://blog.minitab.com/blog/marilyn-wheatleys-blog/coffee-or-tea-analyzing-categorical-data-with-minitab-v2?hsLang=en). This type of modeling is common to many services and industries. Some of the applications, in addition to predicting no-shows, include:
- Credit scores: What is the probability of default?
- Marketing offers: What are the chances you'll buy a product based on a specific offer?
- Quality: What is the probability of a part failing?
- Human resources: What is the sickness absence rate likely to be?
In all cases, your outcome (the event you are predicting) is discrete and can be split into two separate groups; for example, purchase/no purchase, pass/fail, or show/no show. Using the characteristics of your customers or parts as predictors you can use this modeling technique to predict the outcome.
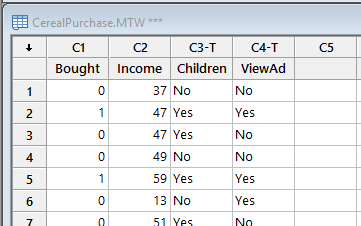 Let’s look at an example. I was unable to find any airline data, so I am illustrating this with one of our Minitab sample data sets, [Cerealpurchase.mtw](http://support.minitab.com/datasets/regression-data-sets/cereal-purchases/).
In this example, a food company surveys consumers to measure the effectiveness of their television ad in getting viewers to buy their cereal. The Bought column has the value 1 if the respondent purchased the cereal, and the value 0 if not. In addition to asking if respondents have seen the ad, the survey also gathers data on the household income and the number of children, which the company also believes might influence the purchase of this cereal.
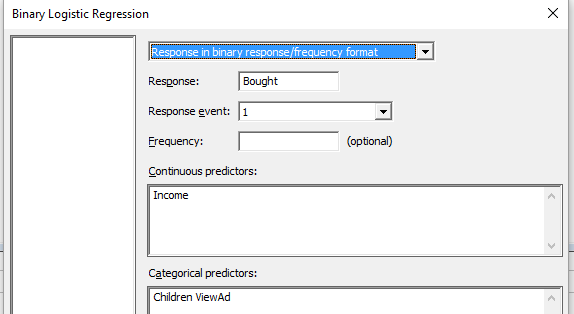
Using **Stat > Regression > Binary Logistic Regression**, I entered the details of the response I wanted to predict, **Bought,** and the value in the Response Event which indicated a purchase. I then entered the Continuous predictor, **Income** and the Categorical predictors **Children** and **ViewAd.** My completed dialog box looks like this:
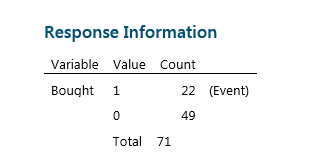
After pressing OK, Minitab performs the analysis and displays the results in the Session window. From this table at the top of the output I can see that the researchers surveyed a sample of 71 customers, of which 22 purchased the cereal.
With Logistic regression, the output features a Deviance Table instead of an Analysis of Variance Table. The calculations and test statistics used with this type of data are different, but we still use the P-value on the far right to determine which factors have an effect on our response.
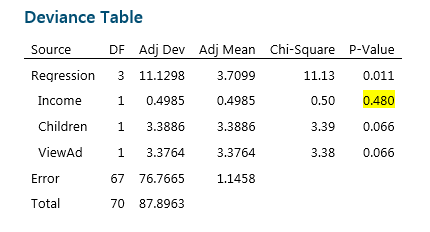
As we would when using other regression methods, we are going to reduce the model by eliminating non-significant terms one at a time. In this case, as highlighted above, Income is not significant. We can simply press Ctrl-E to recall the last dialog box, remove the Income term from the model, and rerun the analysis. Minitab returns the following results:
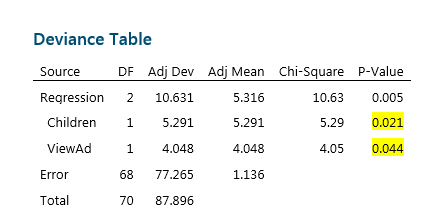
After removing Income, we can see that both Children and ViewAd are significant at the 0.05 significance level. This could be good news for the Marketing Department, as it clearly indicates that viewing the ad did influence the decision to buy. However from this table it is not possible to see if this effect is positive or negative.
To understand this, we need to look at another part of the output. In Binary Logistic Regression, we are trying to estimate the probability of an event. To do this we use the Odds Ratio, which compares the odds of two events by dividing the odds of success under condition A by the odds of success under condition B.
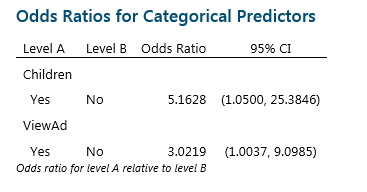
In this example, the Odds Ratio for Children is telling us that respondents who reported they do have children are 5.1628 times more likely to purchase the cereal than those who did not report having children. The good news for the Marketing Department is that customers who viewed the ad were 3.0219 times more likely to purchase the cereal. If the Odds Ratio was less than 1, we would conclude that seeing the advert reduces sales!
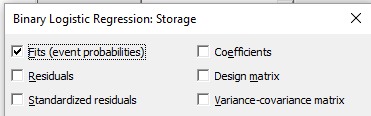 The other way to look at these results is to calculate the probability of purchase and analyse this.
It is easy to calculate the probability of a sale by clicking on the **Storage** button in the **Binary Logistic Regression** dialog box and checking the box labeled **Fits (event probabilities)**. This will store the probability of purchase in the worksheet.
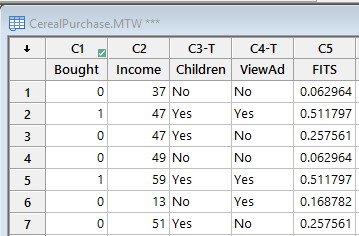
Using the fits data, we can produce a table summarizing the Probability of Purchase for all the combinations of Children and ViewAd, as follows:
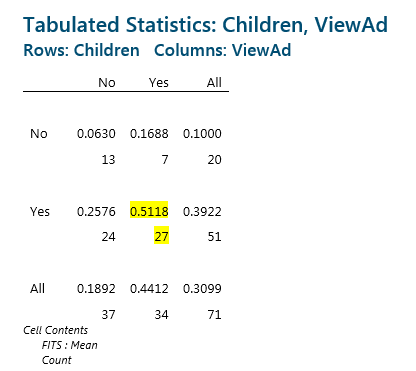
In the rows we have the Children indicator, and in the columns we have the ViewAd indicator. In each cell the top number is the probability of cereal purchase, and the bottom number is the count of customers observed in each of the groups.
Based on this table, customers with children who have seen the ad have a 51% chance of purchase, whereas customers without children who have not seen the ad have a 6% chance of purchase.
Now let's bring this back to our airline example. Using the information about their customers' demographics and flight preferences, an airline can use binary logistic regression to estimate the probabilities of a “no-show” for a whole plane and then determine by how much they should overbook seats. Of course, no model is perfect, and as we saw with United, getting it wrong can have severe consequences.
## You Might Also Like
[How One Hotel Used Data to Improve Guest Satisfaction](https://blog.minitab.com/en/blog/how-one-hotel-used-data-to-improve-guest-satisfaction?hsLang=en)
[Brainstorm](https://blog.minitab.com/en/blog/tag/brainstorm) | 9 Minute Read
[Enhancing Accelerated Underwriting Efficiency with Predictive Analytics](https://blog.minitab.com/en/blog/enhancing-accelerated-underwriting-efficiency-with-predictive-analytics?hsLang=en)
[Regression Analysis](https://blog.minitab.com/en/blog/tag/regression-analysis) | 3 Minute Read
[Predictive Analytics and Determining Patient Length of Stay at Time of Admission](https://blog.minitab.com/en/blog/predictive-analytics-and-determining-patient-length-of-stay-at-time-of-admission?hsLang=en)
[Regression Analysis](https://blog.minitab.com/en/blog/tag/regression-analysis) | 5 Minute Read
---
- [Careers](https://www.minitab.com/en-us/company/careers/)
- [Trust Center](https://www.minitab.com/en-us/trust-center/)
- [Suppliers](https://www.minitab.com/en-us/suppliers/)
- [Site Map](https://www.minitab.com/en-us/site-map/)
- [](https://www.linkedin.com/company/minitab/)
- [](https://www.facebook.com/Minitab/)
- [](https://www.youtube.com/user/MinitabInc)
- [](https://www.instagram.com/minitab/)
---
© 2025 Minitab, LLC. All Rights Reserved.
- [Terms of Use](https://www.minitab.com/en-us/legal/terms-of-use/)
- [Privacy Policy](https://www.minitab.com/en-us/legal/privacy-policy/)
- [Legal](https://www.minitab.com/en-us/legal/)
- Cookies Settings