---
title: How to Create a Graphical Version of the 1-sample t-Test in Minitab
description: How to Create a Graphical Version of the 1-sample t-Test in Minitab
image: https://blog.minitab.com/hubfs/B2BML%20-%20NEW%20FILE%20MANAGER%20STRUCTURE/Blog%20Images/Imported_Blog_Media/1t_swo-Jul-06-2025-12-39-18-4557-AM.png
---
English
- [English](https://blog.minitab.com/en/?hsLang=en)
- [Français](https://blog.minitab.com/fr/?hsLang=en)
- [Deutsch](https://blog.minitab.com/de/?hsLang=en)
- [Português](https://blog.minitab.com/pt/?hsLang=en)
- [Español](https://blog.minitab.com/es/?hsLang=en)
- [日本語](https://blog.minitab.com/ja/?hsLang=en)
- [한국어](https://blog.minitab.com/ko/?hsLang=en)
- [中文(简体)](https://blog.minitab.com/zh/?hsLang=en)
- [ Partners](https://www.minitab.com/en-us/company/partners/)
- [ Contact](https://www.minitab.com/en-us/company/contact-us/)
- [ Talk to Minitab](https://www.minitab.com/en-us/talk-to-minitab/)
- [ My Account](https://licensing.minitab.com/account/manage)
[](https://www.minitab.com/en-us/)
- Products
Back
[Products](https://www.minitab.com/en-us/products/)
[All Products](https://www.minitab.com/en-us/products/)
- [Minitab Solution Center](https://www.minitab.com/en-us/products/minitab-solution-center/)
- [Minitab Statistical Software](https://www.minitab.com/en-us/products/minitab/)
- [Minitab Connect](https://www.minitab.com/en-us/products/connect/)
- [Minitab Model Ops](https://www.minitab.com/en-us/products/model-ops/)
- [Minitab Education Hub](https://www.minitab.com/en-us/products/education-hub/)
- [Minitab Engage](https://www.minitab.com/en-us/products/engage/)
- [Minitab Workspace](https://www.minitab.com/en-us/products/workspace/)
- [Real-Time SPC](https://www.minitab.com/en-us/products/real-time-spc/)
- [Prolink Data Collection & SPC](https://www.minitab.com/en-us/products/prolink)
- [Simul8 Discrete Event Simulation](https://info.minitab.com/en/new-to-simul8?hsLang=en)
- [SPM](https://www.minitab.com/en-us/products/spm/)
- Solutions
Back
[Solutions](https://www.minitab.com/en-us/solutions/)
[All Solutions](https://www.minitab.com/en-us/solutions/)
- [Analytics](https://www.minitab.com/en-us/solutions/analytics/)
- [Statistics & Predictive Analytics](https://www.minitab.com/en-us/solutions/analytics/statistical-analysis-predictive-analytics/)
- [Data Science & Machine Learning](https://www.minitab.com/en-us/solutions/analytics/data-science-machine-learning/)
- [Business Analytics & Intelligence](https://www.minitab.com/en-us/solutions/analytics/business-analytics-intelligence/)
- [Statistical Process Control](https://www.minitab.com/en-us/solutions/analytics/statistical-process-control/)
- [Quality Analytics](https://www.minitab.com/en-us/solutions/analytics/quality-analytics/)
- [Live Analytics](https://www.minitab.com/en-us/solutions/analytics/live-analytics/)
- [Reliability & Life Data Analysis](https://www.minitab.com/en-us/solutions/analytics/reliability/)
- [Discrete Event Simulation](https://info.minitab.com/en/new-to-simul8?hsLang=en)
- [Process Mining](https://info.minitab.com/en/new-to-simul8?hsLang=en)
- [Key Capabilities](https://www.minitab.com/en-us/solutions/key-capabilities/)
- [Continuous Improvement](https://www.minitab.com/en-us/solutions/key-capabilities/continuous-improvement/)
- [Data Integration & Data Prep](https://www.minitab.com/en-us/solutions/key-capabilities/data-integration-data-prep/)
- [Diagramming & Mind Mapping](https://www.minitab.com/en-us/solutions/key-capabilities/diagramming-mind-mapping/)
- [Digital Twins](https://info.minitab.com/en/new-to-simul8?hsLang=en)
- [Model Deployment & ML Ops](https://www.minitab.com/en-us/solutions/key-capabilities/model-deployment-ml-ops/)
- [Innovation & Project Management](https://www.minitab.com/en-us/solutions/key-capabilities/innovation-project-management/)
- [Process Excellence: Detect, Correct & Prevent](https://www.minitab.com/en-us/solutions/key-capabilities/process-excellence/)
- [Featured Industries](https://www.minitab.com/en-us/solutions/industry/)
- [Academic](https://www.minitab.com/en-us/solutions/industry/academic/)
- [Energy & Natural Resources](https://www.minitab.com/en-us/solutions/industry/energy-resources/)
- [Government & Public Sector](https://www.minitab.com/en-us/solutions/industry/government/)
- [Healthcare](https://www.minitab.com/en-us/solutions/industry/healthcare/)
- [Insurance](https://www.minitab.com/en-us/solutions/industry/insurance/)
- [Manufacturing & Industrial](https://www.minitab.com/en-us/solutions/industry/manufacturing-industrial/)
- [Services](https://www.minitab.com/en-us/solutions/industry/service-industries/)
- [Software & Technology](https://www.minitab.com/en-us/solutions/industry/software-technology/)
- [Construction](https://www.minitab.com/en-us/solutions/industry/construction/)
- [Featured Roles](https://www.minitab.com/en-us/solutions/role/)
- [Engineering](https://www.minitab.com/en-us/solutions/role/engineering/)
- [Business Analysis](https://www.minitab.com/en-us/solutions/role/business-analysts/)
- [Information Technology](https://www.minitab.com/en-us/solutions/role/information-technology/)
- [Supply Chain](https://www.minitab.com/en-us/solutions/role/supply-chain/)
- [Customer Service & Contact Center](https://www.minitab.com/en-us/solutions/role/customer-service-contact-center/)
- [Human Resources](https://www.minitab.com/en-us/solutions/role/human-resources/)
- [Marketing](https://www.minitab.com/en-us/solutions/role/marketing/)
- [Research and Development](https://www.minitab.com/en-us/solutions/role/research-and-development/)
- Resources & Services
Back
[Resources & Services](https://www.minitab.com/en-us/resources-services/)
[All Resources & Services](https://www.minitab.com/en-us/resources-services/)
- [Resources](https://www.minitab.com/en-us/resources-services/resources/)
- [Case Studies](https://www.minitab.com/en-us/resources-services/resources/case-studies/)
- [eBooks & White Papers](https://www.minitab.com/en-us/resources-services/resources/ebooks-and-white-papers/)
- [Blog](https://blog.minitab.com/blog/?hsLang=en)
- [Data Sets](https://www.minitab.com/en-us/resources-services/resources/data-set/)
- [Webinars & Events](https://www.minitab.com/en-us/resources-services/resources/events/)
- [Education Hub](https://www.minitab.com/en-us/resources-services/resources/education-hub/)
- [Services](https://www.minitab.com/en-us/resources-services/services/)
- [Training](https://www.minitab.com/en-us/resources-services/services/training/)
- [Deployment](https://www.minitab.com/en-us/resources-services/services/deployment/)
- [Consulting](https://www.minitab.com/en-us/resources-services/services/statistical-consulting/)
- [Self-Paced Learning](https://www.minitab.com/en-us/resources-services/services/self-paced-learning/)
- [Continuing Education](https://www.minitab.com/en-us/resources-services/services/continuing-education/)
- Support
Back
[Support](https://www.minitab.com/en-us/support/)
[Technical Support](https://www.minitab.com/en-us/support/)
- [Subscriptions & Activation](https://www.minitab.com/en-us/support/subscriptions-and-activation/)
- [Minitab Quick Start](https://www.minitab.com/en-us/support/quick-start/)
- [Training](https://www.minitab.com/en-us/resources-services/services/training/)
- [Installation Support](https://www.minitab.com/en-us/support/installation/)
- [Support Videos](https://www.minitab.com/en-us/support/videos/)
- [Support Documentation](https://www.minitab.com/en-us/support/documents/)
- [Software Updates](https://www.minitab.com/en-us/support/software-updates/)
- [Product Downloads](https://www.minitab.com/en-us/support/downloads/)
- [Support Policy](https://www.minitab.com/en-us/support/policy/)
- Company
Back
[Company](https://www.minitab.com/en-us/company/)
[Company](https://www.minitab.com/en-us/company/)
- [About Us](https://www.minitab.com/en-us/company/our-company/)
- [Leadership Team](https://www.minitab.com/en-us/company/leadership-team/)
- [Partners](https://www.minitab.com/en-us/company/partners/)
- [Careers](https://www.minitab.com/en-us/company/careers/)
- [Contact](https://www.minitab.com/en-us/company/contact-us/)
- [News](https://www.minitab.com/en-us/company/press-releases/)
[Try/Buy](https://www.minitab.com/en-us/try-buy/)
- [Statistics](https://blog.minitab.com/en/blog/tag/statistics)
- [Data Analysis](https://blog.minitab.com/en/blog/tag/data-analysis)
-
- [Quality Improvement](https://blog.minitab.com/en/blog/tag/quality-improvement)
- [Subscribe](https://info.minitab.com/blog/subscribe?hsLang=en)

## Notice
You are now leaving minitab.com.
Click Continue to proceed to:
Continue
Go Back
# How to Create a Graphical Version of the 1-sample t-Test in Minitab
Minitab Blog Editor | 3/25/2015
Topics: [Six Sigma](https://blog.minitab.com/en/blog/tag/six-sigma), [Hypothesis Testing](https://blog.minitab.com/en/blog/tag/hypothesis-testing)
- [Share](https://www.linkedin.com/shareArticle?mini=true&url=https://blog.minitab.com/en/blog/adventures-in-statistics-2/how-to-create-a-graphical-version-of-the-1-sample-t-test-in-minitab)
- [Share](https://www.facebook.com/sharer.php?u=https://blog.minitab.com/en/blog/adventures-in-statistics-2/how-to-create-a-graphical-version-of-the-1-sample-t-test-in-minitab)
This is a engage post for a series of blog posts about understanding hypothesis tests. In this series, I create a graphical equivalent to a 1-sample t-test and confidence interval to help you understand how it works more intuitively.
This post focuses entirely on the steps required to create the graphs. It’s a fairly technical and task-oriented post designed for those who need to create the graphs for illustrative purposes. If you’d instead like to gain a better understanding of the concepts behind the graphs, please see the following posts:
- [Understanding Hypothesis Tests: Why We Need to Use Hypothesis Tests](https://blog.minitab.com/blog/adventures-in-statistics/understanding-hypothesis-tests%3A-why-we-need-to-use-hypothesis-tests-in-statistics?hsLang=en)
- [Understanding Hypothesis Tests: The Significance Level and P Values](https://blog.minitab.com/blog/adventures-in-statistics/understanding-hypothesis-tests%3A-significance-levels-alpha-and-p-values-in-statistics?hsLang=en)
- [Understanding Hypothesis Tests: Confidence Intervals and Confidence Levels](https://blog.minitab.com/blog/adventures-in-statistics/understanding-hypothesis-tests%3A-confidence-intervals-and-confidence-levels?hsLang=en)
To create the following graphs, we’ll use Minitab’s [probability distribution plots](https://blog.minitab.com/blog/adventures-in-statistics/graphing-distributions-with-probability-distribution-plots?hsLang=en) in conjunction with several statistics obtained from the 1-sample t output. If you’d like more information about the formulas that are involved, you can find them in Minitab at: **Help > Methods and Formulas > Basic Statistics > 1-Sample t**.
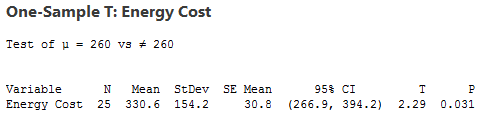
The data for this example is [FamilyEnergyCost](http://support.minitab.com/datasets/FamilyEnergyCost.MTW) and it is just one of the many data set examples that can be found in [Minitab’s Data Set Library](http://support.minitab.com/datasets/). We’ll perform the regular 1-sample t-test with a null hypothesis mean of 260, and then graphically recreate the results.
## How to Graph the Two-Tailed Critical Region for a Significance Level of 0.05
To create a graphical equivalent to a 1-sample t-test, we’ll need to graph the [t-distribution](http://support.minitab.com/en-us/minitab/17/topic-library/basic-statistics-and-graphs/probability-distributions-and-random-data/distributions/t-distribution/) using the correct number of degrees of freedom. For a 1-sample t-test, the degrees of freedom equals the sample size minus 1. So, that’s 24 degrees of freedom for our sample of 25.
1. In Minitab, choose: **Graph > Probability Distribution Plot > View Probability**.
2. In **Distribution**, select **t**.
3. In **Degrees of freedom**, enter *24*.
4. Click the **Shaded Area** tab.
5. In **Define Shaded Area By**, select **Probability** and **Both Tails**.
6. In **Probability**, enter *0.05*.
7. Click **OK**.
You should see this graph.
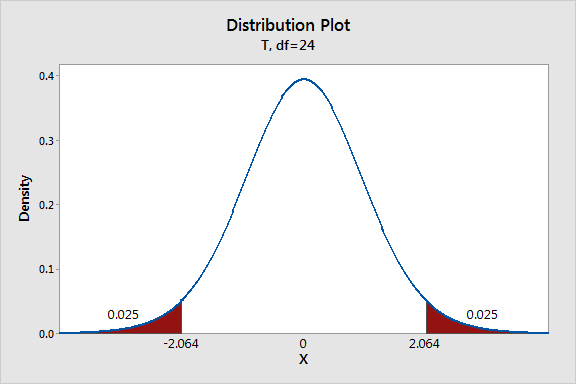
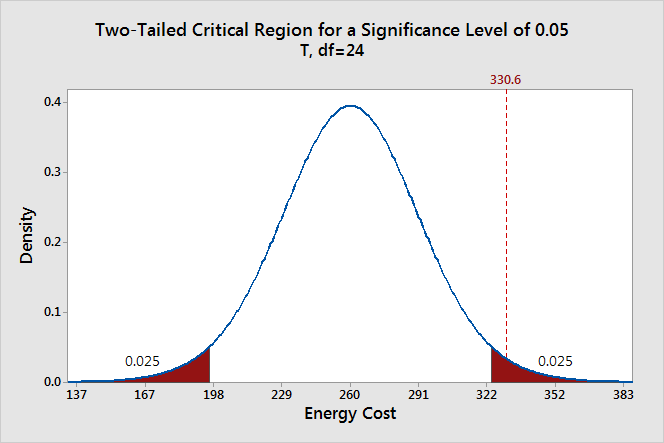
This graph shows the distribution of t-values for a sample of our size with the t-values for the end points of the critical region. The [t-value](http://support.minitab.com/en-us/minitab/17/topic-library/basic-statistics-and-graphs/hypothesis-tests/tests-of-means/what-is-a-t-value/) for our sample mean is 2.29 and it falls within the critical region.
For my blog posts, I thought displaying the x-axis in the same units as our measurement variable (energy costs) would make the graph easier to understand. To do this, we need to transform the x-axis scale from t-values to energy costs.
Transforming the t-values to energy costs for a distribution centered on the null hypothesis mean requires a simple calculation:
Energy Cost = Null Hypothesis Mean + (t-value \* SE Mean)
We’ll use the null hypothesis value that we entered in the dialog box (260) and the SE Mean value that appears in the 1-sample t-test output (30.8). We need to calculate the energy cost values for all of the t-values that will appear on the x-axis (-4 to +4).
For example, a t-value of 1 equals 290.8 (260 + (1\*30.8). Zero is the null hypothesis value, which is 260.
Next, we need to replace the t-values with the energy cost equivalents.
1. Choose **Editor > Select Item > X Scale**.
2. Choose **Editor > Edit X Scale**.
3. In **Major Tick Position**, choose **Number of Ticks** and enter *9*.
4. Click the **Show** tab and check the **Low** check box for **Major ticks** and **Major tick labels**.
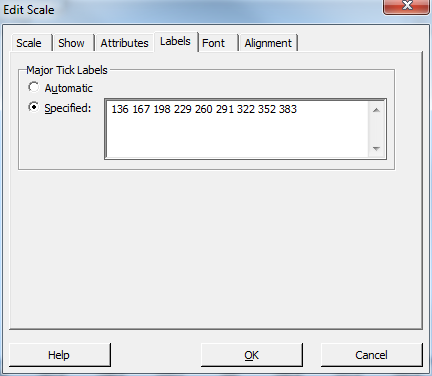
5. Click the **Labels** tab of the dialog box that appears. Enter the energy cost values that you calculated as shown below. I use rounded values to keep the x-axis tidy. Click **OK**.
You should see this graph. To cleanup the x-axis, I had to delete the t-values that were still showing from before. Simply click each t-value once and press the **Delete** key.
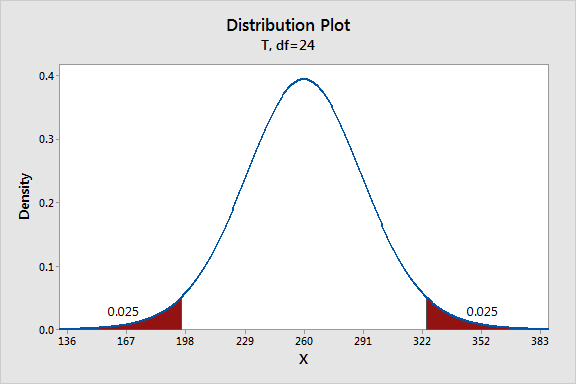
Let’s add a reference line to show where our sample mean falls within the sampling distribution and critical region. The trick here is that the x-axis still uses t-values despite displaying the energy costs. We need to use the t-value for our sample mean that appears in the 1-sample t output (2.29).
1. Choose **Editor > Add > Reference Lines**.
2. In **Show reference lines at X values**, enter *2.29.*
3. Click **OK**.
4. Double click the *2.29* that now appears on the graph.
5. In the dialog box that appears, enter *330.6* in **Text**.
6. Click **OK**.
After editing the title and the x-axis label, you should have a graph similar to the one below.
## How to Graph the P Value for a 1-sample t-Test
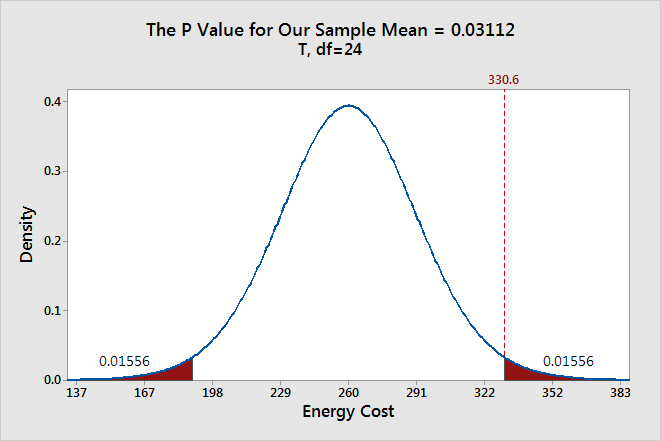
To do this, we’ll duplicate the graph we created above and then modify it. This allows us to reuse some of the work that we’ve already done.
1. Make sure the graph we created is selected.
2. Choose **Editor > Duplicate Graph**.
3. Double click the blue distribution curve on the graph.
4. Click the **Shaded Area** tab in the dialog box that appears.
5. In **Define Shaded Area By**, select **X Value** and **Both Tails**.
6. In **X value**, enter *2.29*.
7. Click **OK**.
You’ll need to edit the graph title and delete some extra numbers on the x-axis. After these edits, you should have a graph similar to this one.
### How to Graph the Confidence Interval for a 1-sample t-test
To graphically recreate the confidence interval, we’ll need to start from scratch for this graph.
1. In Minitab, choose: **Graph > Probability Distribution Plot > View Probability**.
2. In **Distribution**, select **t**.
3. In **Degrees of freedom**, enter *24*.
4. Click the **Shaded Area** tab.
5. In **Define Shaded Area By**, select **Probability** and **Middle**.
6. Enter *0.025* in both **Probability 1** and **Probability 2**.
7. Click **OK**.
Your graph should look like this:
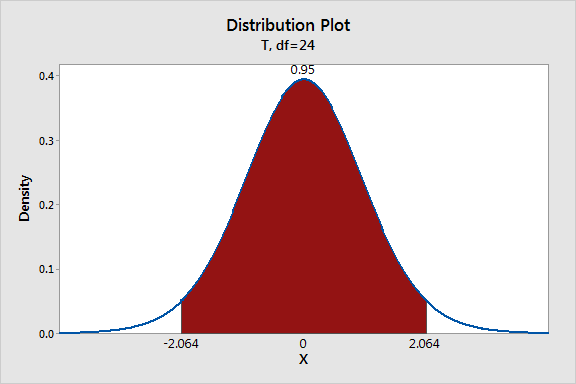
Like before, we’ll need to transform the x-axis into energy costs. For this graph, I’ll only display the x-values for the end points of the confidence interval and the sample mean. So, we need to convert the three t-values of -2.064, 0, 2.064.
The equation to transform the t-values to energy costs for a distribution centered on the sample mean is:
Energy Cost = Sample Mean + (t-score \* SE Mean)
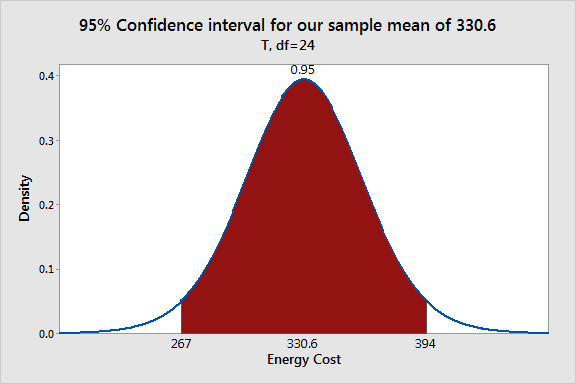
We obtain the following rounded values that represent the lower confidence limit, sample mean, and upper confidence limit: 267, 330.6, 394.
Simply double click the values in the x-axis to edit each individual label. Replace the t-value with the energy cost value. After editing the graph title, you should have a visual representation of the confidence interval that looks like this. I rounded the values for the confidence limits.
## Consider Using Minitab's Command Language
When I create multiple graphs that involve many steps, I generally use Minitab's command language. This may sound daunting if you're not familiar with using this command language. However, Minitab makes this easier for you.
After you create one graph, choose **Editor > Copy Command Language**, and paste it into a text editor, such as Notepad. Save the file with the extension \*.mtb and you have a Minitab Exec file. This Exec file contains all of the edits you made. Now, you can easily create similar graphs simply by modifying the parts that you want to change.
You can also get help for the command language right in Minitab. First, make sure the command prompt is enabled by choosing **Editor > Enable Commands**. At the prompt, type *help dplot*, and Minitab displays the help specific to probability distribution plots!
To run an exec file, choose **File > Other Files > Run an Exec**. Click **Select File** and browse to the file you saved. Here are the MTB files for my graphs for the [critical region](https://cdn.app.compendium.com/uploads/user/458939f4-fe08-4dbc-b271-efca0f5a2682/742d7708-efd3-492c-abff-6044d78e3bbd/File/e4994557f813b872b03687363259faa2/prob_plot_alpha.mtb), [P value](https://cdn.app.compendium.com/uploads/user/458939f4-fe08-4dbc-b271-efca0f5a2682/742d7708-efd3-492c-abff-6044d78e3bbd/File/3a0e83912f4826db06ee8c0777a5cf73/prob_plot_p.mtb), and [confidence interval](https://cdn.app.compendium.com/uploads/user/458939f4-fe08-4dbc-b271-efca0f5a2682/742d7708-efd3-492c-abff-6044d78e3bbd/File/00f225aa85ce31c80cfae24c1704fa1c/ci_sample.mtb).
Happy graphing!
## You Might Also Like
[How Minitab's Analytics Help Solve Government Challenges](https://blog.minitab.com/en/blog/how-minitabs-analytics-help-solve-government-challenges?hsLang=en)
[Hypothesis Testing](https://blog.minitab.com/en/blog/tag/hypothesis-testing) | 6 Minute Read
[Minitab Analysis Reveals Surprising Traveler Preferences for Top Vacation Rental Provider](https://blog.minitab.com/en/blog/customer-preferences-revealed-vacation-rental-provider?hsLang=en)
[Hypothesis Testing](https://blog.minitab.com/en/blog/tag/hypothesis-testing) | 3 Minute Read
[What Makes A Good Wine? Using Statistical Regression to Model The Taste of Wine](https://blog.minitab.com/en/blog/using-statistical-regression-to-model-the-taste-of-wine?hsLang=en)
[Hypothesis Testing](https://blog.minitab.com/en/blog/tag/hypothesis-testing) | 6 Minute Read
---
- [Careers](https://www.minitab.com/en-us/company/careers/)
- [Trust Center](https://www.minitab.com/en-us/trust-center/)
- [Suppliers](https://www.minitab.com/en-us/suppliers/)
- [Site Map](https://www.minitab.com/en-us/site-map/)
- [](https://www.linkedin.com/company/minitab/)
- [](https://www.facebook.com/Minitab/)
- [](https://www.youtube.com/user/MinitabInc)
- [](https://www.instagram.com/minitab/)
---
© 2025 Minitab, LLC. All Rights Reserved.
- [Terms of Use](https://www.minitab.com/en-us/legal/terms-of-use/)
- [Privacy Policy](https://www.minitab.com/en-us/legal/privacy-policy/)
- [Legal](https://www.minitab.com/en-us/legal/)
- Cookies Settings