


When problems in your service or product affect your customers, you need to identify the cause clearly with data-driven insights and avoid misdirection from misconceptions.
At this year's Minitab Insights Events in Europe, we showed this example project for investigating and resolving a customer complaint. Today we're sharing that roadmap in this blog, which follows the popular steps, or 'phases', of the Lean Six Sigma DMAIC methodology.
Learn how to:
- Define the problem, measure and prepare data, and evaluate the baseline performance
- Identify and test opportunities for improvement
- Reveal the most effective solution
- Implement and maintain the solution for best results
Let's get started with Part One: defining our project and validating our data.
Using The Customer's Biggest Pain As Your Focus
If you are capturing customer complaint data - and you should be - it will often reveal meaningful opportunities for improvement.
In this example, a mobile phone service provider is reviewing its performance. They wisely start by looking at a log of customer complaints overs 9 months.
Let's see how this project can progress with the DMAIC methodology's first phase: define.
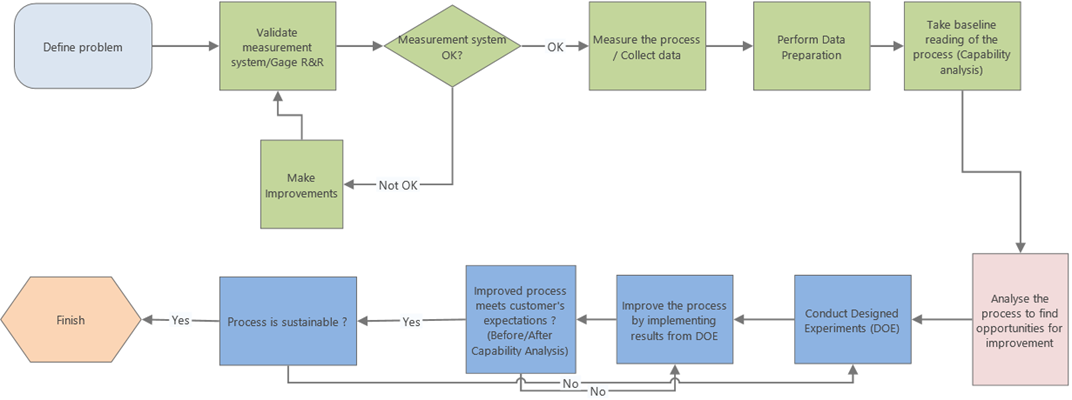
DEFINE:
Identify the most common complaint
Organizations usually capture customer complaint data in a CRM system. If no formal structure or field is in place, this data may be entered in open text fields - e.g. notes or comments - and not be categorized.
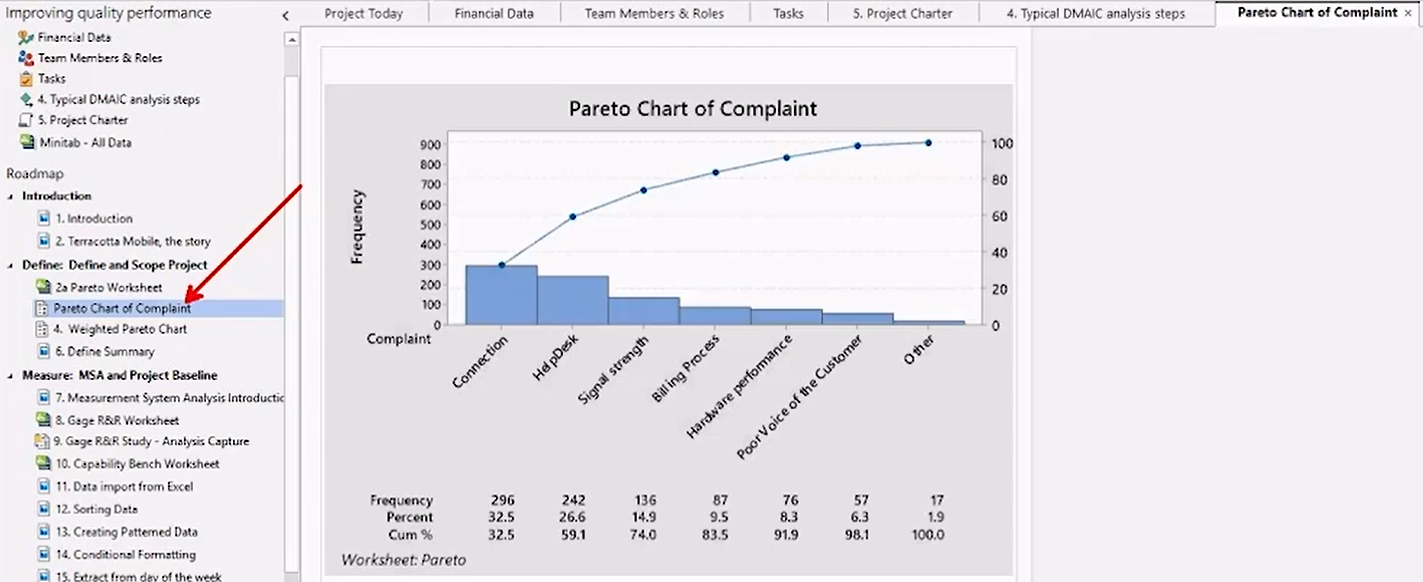
In this example, the mobile phone company's dataset had been sorted into these categories of complaint:
- Connection
- Helpdesk
- Signal Strength
- Billing Process
- Hardware Performance
- Poor Voice of the Customer
- Other
A simple Pareto chart in Minitab reveals that Connection complaints are the most common, accounting for 32.5% of complaints.
The chances of a successful Connection are affected by Signal Strength however, which also proved to the third most frequent type of complaint. So the decision is made to investigate both Connection and Signal Strength.
TIP: To record your analysis and track your DMAIC project, use Companion by Minitab to import your Minitab graphs with one click and store them against the relevant stage of the project. Below, the Pareto chart is imported against the Define phase of this project.
Try this seamless way to track your DMAIC projects - click for a free trial of Companion by Minitab
Before we jump into exploring these two issues, we need to make sure that our measurements of Connection and Signal Strength are sound.
MEASURE:
Are these measurements sound? Validating the measurement system
Co
Validate the Measurement System For Each Input & Output Variable
It's worth These are measured differently:
- Connection is measured as 'Yes' or 'No' - was a connection made or not? This is an attribute measurement.
- Signal Strength is measured as a percentage, so it is a continuous measurement.
Several operators record the signal strength from various current phone masts. The Gage R&R shows that the measurement system is acceptable
The variation coming from the measurement of the signal strength is small compared to the process variation at only 9%. There is good precision in the way that measurements are being made.
Measure the process baseline (control charts & capability analysis)
Determine what the issues are in your process (decentering or excess variability or both)
ANALYSE
Analyse deeply your data to determine potential causes and effects (Hypothesis tests, Analyse of Variance, Regression.. Etc .)
IMPROVE
Improve your process by running some designed experiments (Factorial DOE, Response Surface Designs or DOE with discrete data using analysis via Logistic regression.)
Implement a solution and verify that the improvement achieved is statistically significant (Two sample t, before/after Capability Analysis)
CONTROL
Check that the implemented solution provides sustainable results over the longer term (Control Charts and Capability Analysis)