---
title: "ANOVA: Data Means and Fitted Means, Balanced and Unbalanced Designs"
description: "ANOVA: Data Means and Fitted Means, Balanced and Unbalanced Designs"
image: https://blog.minitab.com/hubfs/B2BML%20-%20NEW%20FILE%20MANAGER%20STRUCTURE/Blog%20Images/Imported_Blog_Media/capture-1-Jul-05-2025-10-42-46-4009-PM.png
---
English
- [English](https://blog.minitab.com/en/?hsLang=en)
- [Français](https://blog.minitab.com/fr/?hsLang=en)
- [Deutsch](https://blog.minitab.com/de/?hsLang=en)
- [Português](https://blog.minitab.com/pt/?hsLang=en)
- [Español](https://blog.minitab.com/es/?hsLang=en)
- [日本語](https://blog.minitab.com/ja/?hsLang=en)
- [한국어](https://blog.minitab.com/ko/?hsLang=en)
- [中文(简体)](https://blog.minitab.com/zh/?hsLang=en)
- [ Partners](https://www.minitab.com/en-us/company/partners/)
- [ Contact](https://www.minitab.com/en-us/company/contact-us/)
- [ Talk to Minitab](https://www.minitab.com/en-us/talk-to-minitab/)
- [ My Account](https://licensing.minitab.com/account/manage)
[](https://www.minitab.com/en-us/)
- Products
Back
[Products](https://www.minitab.com/en-us/products/)
[All Products](https://www.minitab.com/en-us/products/)
- [Minitab Solution Center](https://www.minitab.com/en-us/products/minitab-solution-center/)
- [Minitab Statistical Software](https://www.minitab.com/en-us/products/minitab/)
- [Minitab Connect](https://www.minitab.com/en-us/products/connect/)
- [Minitab Model Ops](https://www.minitab.com/en-us/products/model-ops/)
- [Minitab Education Hub](https://www.minitab.com/en-us/products/education-hub/)
- [Minitab Engage](https://www.minitab.com/en-us/products/engage/)
- [Minitab Workspace](https://www.minitab.com/en-us/products/workspace/)
- [Real-Time SPC](https://www.minitab.com/en-us/products/real-time-spc/)
- [Prolink Data Collection & SPC](https://www.minitab.com/en-us/products/prolink)
- [Simul8 Discrete Event Simulation](https://info.minitab.com/en/new-to-simul8?hsLang=en)
- [SPM](https://www.minitab.com/en-us/products/spm/)
- Solutions
Back
[Solutions](https://www.minitab.com/en-us/solutions/)
[All Solutions](https://www.minitab.com/en-us/solutions/)
- [Analytics](https://www.minitab.com/en-us/solutions/analytics/)
- [Statistics & Predictive Analytics](https://www.minitab.com/en-us/solutions/analytics/statistical-analysis-predictive-analytics/)
- [Data Science & Machine Learning](https://www.minitab.com/en-us/solutions/analytics/data-science-machine-learning/)
- [Business Analytics & Intelligence](https://www.minitab.com/en-us/solutions/analytics/business-analytics-intelligence/)
- [Statistical Process Control](https://www.minitab.com/en-us/solutions/analytics/statistical-process-control/)
- [Quality Analytics](https://www.minitab.com/en-us/solutions/analytics/quality-analytics/)
- [Live Analytics](https://www.minitab.com/en-us/solutions/analytics/live-analytics/)
- [Reliability & Life Data Analysis](https://www.minitab.com/en-us/solutions/analytics/reliability/)
- [Discrete Event Simulation](https://info.minitab.com/en/new-to-simul8?hsLang=en)
- [Process Mining](https://info.minitab.com/en/new-to-simul8?hsLang=en)
- [Key Capabilities](https://www.minitab.com/en-us/solutions/key-capabilities/)
- [Continuous Improvement](https://www.minitab.com/en-us/solutions/key-capabilities/continuous-improvement/)
- [Data Integration & Data Prep](https://www.minitab.com/en-us/solutions/key-capabilities/data-integration-data-prep/)
- [Diagramming & Mind Mapping](https://www.minitab.com/en-us/solutions/key-capabilities/diagramming-mind-mapping/)
- [Digital Twins](https://info.minitab.com/en/new-to-simul8?hsLang=en)
- [Model Deployment & ML Ops](https://www.minitab.com/en-us/solutions/key-capabilities/model-deployment-ml-ops/)
- [Innovation & Project Management](https://www.minitab.com/en-us/solutions/key-capabilities/innovation-project-management/)
- [Process Excellence: Detect, Correct & Prevent](https://www.minitab.com/en-us/solutions/key-capabilities/process-excellence/)
- [Featured Industries](https://www.minitab.com/en-us/solutions/industry/)
- [Academic](https://www.minitab.com/en-us/solutions/industry/academic/)
- [Energy & Natural Resources](https://www.minitab.com/en-us/solutions/industry/energy-resources/)
- [Government & Public Sector](https://www.minitab.com/en-us/solutions/industry/government/)
- [Healthcare](https://www.minitab.com/en-us/solutions/industry/healthcare/)
- [Insurance](https://www.minitab.com/en-us/solutions/industry/insurance/)
- [Manufacturing & Industrial](https://www.minitab.com/en-us/solutions/industry/manufacturing-industrial/)
- [Services](https://www.minitab.com/en-us/solutions/industry/service-industries/)
- [Software & Technology](https://www.minitab.com/en-us/solutions/industry/software-technology/)
- [Construction](https://www.minitab.com/en-us/solutions/industry/construction/)
- [Featured Roles](https://www.minitab.com/en-us/solutions/role/)
- [Engineering](https://www.minitab.com/en-us/solutions/role/engineering/)
- [Business Analysis](https://www.minitab.com/en-us/solutions/role/business-analysts/)
- [Information Technology](https://www.minitab.com/en-us/solutions/role/information-technology/)
- [Supply Chain](https://www.minitab.com/en-us/solutions/role/supply-chain/)
- [Customer Service & Contact Center](https://www.minitab.com/en-us/solutions/role/customer-service-contact-center/)
- [Human Resources](https://www.minitab.com/en-us/solutions/role/human-resources/)
- [Marketing](https://www.minitab.com/en-us/solutions/role/marketing/)
- [Research and Development](https://www.minitab.com/en-us/solutions/role/research-and-development/)
- Resources & Services
Back
[Resources & Services](https://www.minitab.com/en-us/resources-services/)
[All Resources & Services](https://www.minitab.com/en-us/resources-services/)
- [Resources](https://www.minitab.com/en-us/resources-services/resources/)
- [Case Studies](https://www.minitab.com/en-us/resources-services/resources/case-studies/)
- [eBooks & White Papers](https://www.minitab.com/en-us/resources-services/resources/ebooks-and-white-papers/)
- [Blog](https://blog.minitab.com/blog/?hsLang=en)
- [Data Sets](https://www.minitab.com/en-us/resources-services/resources/data-set/)
- [Webinars & Events](https://www.minitab.com/en-us/resources-services/resources/events/)
- [Education Hub](https://www.minitab.com/en-us/resources-services/resources/education-hub/)
- [Services](https://www.minitab.com/en-us/resources-services/services/)
- [Training](https://www.minitab.com/en-us/resources-services/services/training/)
- [Deployment](https://www.minitab.com/en-us/resources-services/services/deployment/)
- [Consulting](https://www.minitab.com/en-us/resources-services/services/statistical-consulting/)
- [Self-Paced Learning](https://www.minitab.com/en-us/resources-services/services/self-paced-learning/)
- [Continuing Education](https://www.minitab.com/en-us/resources-services/services/continuing-education/)
- Support
Back
[Support](https://www.minitab.com/en-us/support/)
[Technical Support](https://www.minitab.com/en-us/support/)
- [Subscriptions & Activation](https://www.minitab.com/en-us/support/subscriptions-and-activation/)
- [Minitab Quick Start](https://www.minitab.com/en-us/support/quick-start/)
- [Training](https://www.minitab.com/en-us/resources-services/services/training/)
- [Installation Support](https://www.minitab.com/en-us/support/installation/)
- [Support Videos](https://www.minitab.com/en-us/support/videos/)
- [Support Documentation](https://www.minitab.com/en-us/support/documents/)
- [Software Updates](https://www.minitab.com/en-us/support/software-updates/)
- [Product Downloads](https://www.minitab.com/en-us/support/downloads/)
- [Support Policy](https://www.minitab.com/en-us/support/policy/)
- Company
Back
[Company](https://www.minitab.com/en-us/company/)
[Company](https://www.minitab.com/en-us/company/)
- [About Us](https://www.minitab.com/en-us/company/our-company/)
- [Leadership Team](https://www.minitab.com/en-us/company/leadership-team/)
- [Partners](https://www.minitab.com/en-us/company/partners/)
- [Careers](https://www.minitab.com/en-us/company/careers/)
- [Contact](https://www.minitab.com/en-us/company/contact-us/)
- [News](https://www.minitab.com/en-us/company/press-releases/)
[Try/Buy](https://www.minitab.com/en-us/try-buy/)
- [Statistics](https://blog.minitab.com/en/blog/tag/statistics)
- [Data Analysis](https://blog.minitab.com/en/blog/tag/data-analysis)
-
- [Quality Improvement](https://blog.minitab.com/en/blog/tag/quality-improvement)
- [Subscribe](https://info.minitab.com/blog/subscribe?hsLang=en)

## Notice
You are now leaving minitab.com.
Click Continue to proceed to:
Continue
Go Back
# ANOVA: Data Means and Fitted Means, Balanced and Unbalanced Designs
Minitab Blog Editor | 2/3/2016
Topics: [Statistics](https://blog.minitab.com/en/blog/tag/statistics)
- [Share](https://www.linkedin.com/shareArticle?mini=true&url=https://blog.minitab.com/en/blog/marilyn-wheatleys-blog/anova-data-means-and-fitted-means-balanced-and-unbalanced-designs)
- [Share](https://www.facebook.com/sharer.php?u=https://blog.minitab.com/en/blog/marilyn-wheatleys-blog/anova-data-means-and-fitted-means-balanced-and-unbalanced-designs)
In this post, I’ll address some common questions we’ve received in [technical support](http://support.minitab.com) about the difference between fitted and data means, where to find each option within Minitab, and how Minitab calculates each.
First, let’s look at some definitions. It’s useful to have an example, so I’ll be using the Light Output data set from Minitab’s Data Set Library, which includes a description of the sample data [here](http://support.minitab.com/en-us/datasets/anova-data-sets/light-output-data/) . This same data set is available within Minitab by choosing **File** > **Open Worksheet** , clicking the **Look in Minitab Sample Data folder** button at the bottom, and then opening the file titled **LightOutput\_model.MTW** .
## Calculating Data Means
In an ANOVA, data means are the raw response variable means for each factor/level combination.
For the LightOutput data set, we can calculate the data means for Temperature by choosing **Stat** > **Basic Statistics** > **Display Descriptive Statistics**, and then completing the dialog box as shown below:
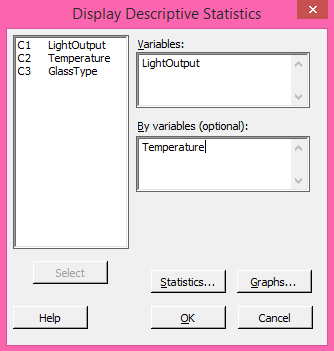
Click the **Statistics** button and make sure only **Mean** is selected, then click **OK** in each dialog. Repeat the above steps, and replace Temperature with GlassType to calculate the data means for that second factor. The session window will display these results:
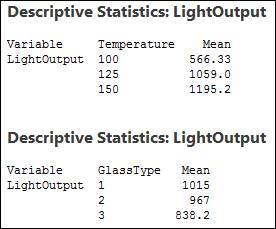
The means calculated directly from the data shown above are the values that would be plotted in a Main Effects plot. To create that plot in Minitab, use **Stat** > **ANOVA** > **Main Effects Plot** and complete the dialog box as shown below:
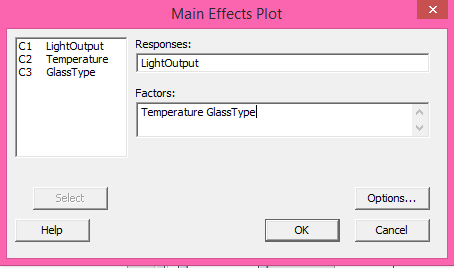
Click **OK** display the graph, which will show the same mean values for each level of the two factors (I’ve added data labels to the graph below):
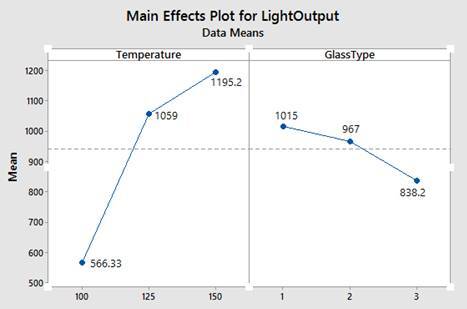
So, **data means** are the *raw response variable means* for each factor/level combination. On the other hand, **fitted means** use least squares regression to predict the mean response values of a balanced design, in which your data has the same number of observations for every combination of factor levels. The two types of means are identical for balanced designs but can be different for unbalanced designs.
## Balanced Designs
As I mentioned above, in ANOVA a balanced design has an equal number of observations for all possible combinations of factor levels, whereas an unbalanced design has an unequal number of observations.
If you’re not sure whether your design is balanced or not, Minitab makes it easy to find out. For the Light output data set, we can see that the design is balanced by choosing **Stat** > **Tables** > **Cross Tabulation and Chi-Square**, and then completing the dialog as shown below:
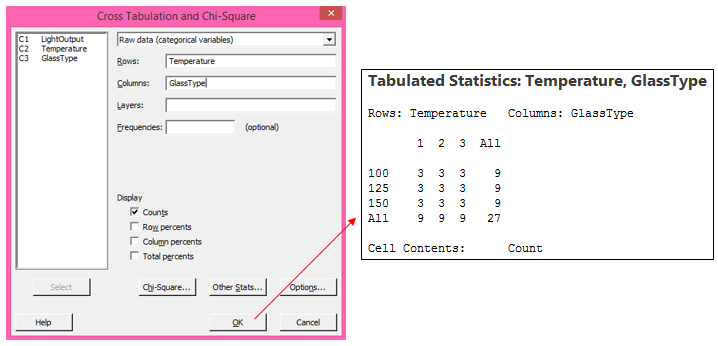
Because there are 3 observations for every combination of Temperature and GlassType, this design is balanced.
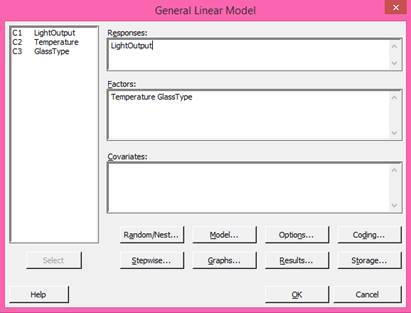
We can fit a model to this data by choosing **Stat** > **ANOVA** > **General Linear Model** > **Fit General Linear Model**, and then completing that dialog box as shown below and clicking **OK**:
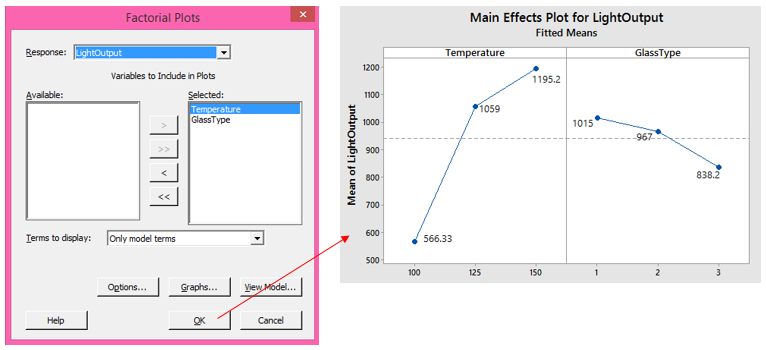
Now that we have a model for this data, we can obtain a main effect plot based on the least-squares model by choosing **Stat** > **ANOVA** > **General Linear Model** > **Factorial Plots** (NOTE: The Factorial Plots option will not be available until a model is fit, because these graphs are based on the model). Click **OK** in the dialog box below to accept the defaults and generate the main effects plot:
## Calculating Main Effects for Balanced Designs
Again, the fitted means in the main effects plot above are the same as the previous data means plot because this is a balanced design. In this case, the answer is the same, but Minitab obtained these results by finding the fitted value for every possible combination of factor levels. The following steps illustrate what Minitab is doing automatically, behind the scenes:
1. To obtain these fitted values, after the model has already been fit to the data, type all possible combinations of factor levels into the worksheet as shown below, and then use **Stat** > **ANOVA** > **General Linear Model** > **Predict**, and enter the two columns with all possible combinations:
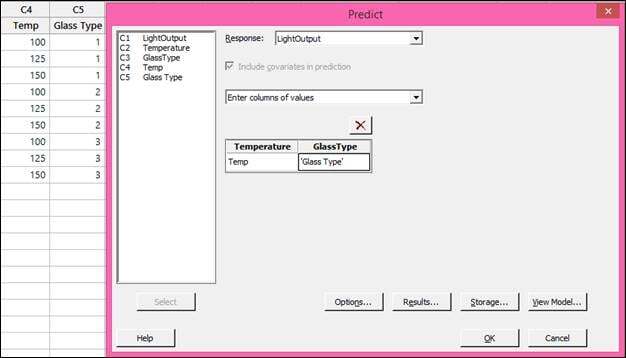
2. Click **OK** in the dialog box above to store the results in the worksheet.
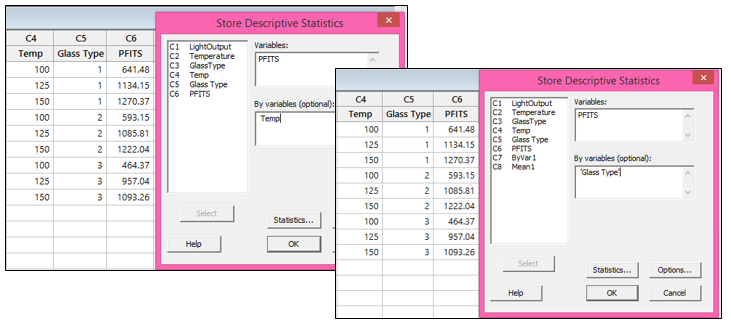
3. Now use **Stat** > **Basic Statistics** > **Store Descriptive Statistics** twice; once to get the means of the fits calculated in step 2 for Temp, and a second time to get the means of the fits for Glass Type:
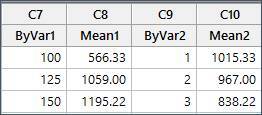
The results show the same means calculated in the fitted means main effects plot:
## Unbalanced Designs
Now let’s take a look at what happens in an unbalanced design, where there are an unequal number of observations per factor/level combination.
First, we’ll need to modify the worksheet to make the design unbalanced. Recall that this data set includes 3 observations per combination of factor levels. To make the design unbalanced, I’m changing the second row of data in the Temperature column. The original value there was 125, and I’ve changed that to 100:
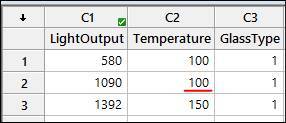
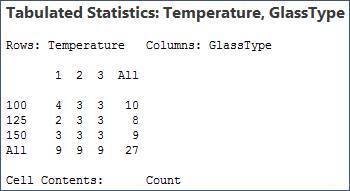
With the data modified as shown above, we can use **Stat** > **Tables** > **Cross Tabulation and Chi-Square** again to see that the design is unbalanced:
## Calculating Main Effects for Unbalanced Designs
Now let’s fit a model to this data using **Stat** > **ANOVA** > **General Linear Model** > **Fit General Linear Model**. This time, click the **Results** button and use the drop-down list next to **Coefficients** to select **Full set of coefficients**, then click **OK** in each dialog. Our results are different. If we generate new factorial plots using the new model, we can see that some of these fitted means are different than those in the balanced model:
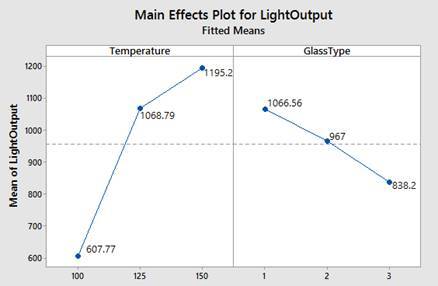
We can calculate the fitted means of the main effects in the same way as we calculated them for the balanced case, or we can see the same results by looking at the full table of coefficients:
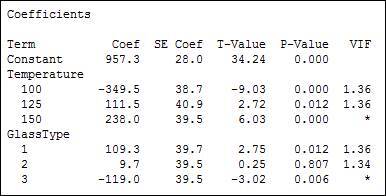
The fitted mean in the main effects plot for temperature at 100 is calculated by adding the coefficient for temperature at 100 to the constant. So 957.3 + (-349.5) = 607.8 (rounded). For temperature at 125, we add 957.3 + 111.5 = 1168.8, and so forth.
If you’ve enjoyed this post and would like to learn more, check out our other blog posts related to [ANOVA](https://blog.minitab.com/blog/statistics-and-quality-data-analysis?blog_id=079e7c3c-16b0-49f1-b495-d019505642f3&search_terms=anova&button-submit.x=0&button-submit.y=0&hsLang=en).
## You Might Also Like
[IT vs. OT: Unlocking the Power of Convergence](https://blog.minitab.com/en/blog/it-vs.-ot-unlocking-the-power-of-convergence?hsLang=en)
[Operations](https://blog.minitab.com/en/blog/tag/operations) | 6 Minute Read
[Updating Graphs, Making Patterned Data and More Tips & Tricks to Help You Master Minitab](https://blog.minitab.com/en/blog/updating-graphs-patterned-data-tips-tricks-master-minitab?hsLang=en)
[Statistics](https://blog.minitab.com/en/blog/tag/statistics) | 6 Minute Read
[Against the Odds: Honoring Women in Math and Statistics](https://blog.minitab.com/en/blog/honoring-women-in-math-and-statistics?hsLang=en)
[Statistics](https://blog.minitab.com/en/blog/tag/statistics) | 5 Minute Read
---
- [Careers](https://www.minitab.com/en-us/company/careers/)
- [Trust Center](https://www.minitab.com/en-us/trust-center/)
- [Suppliers](https://www.minitab.com/en-us/suppliers/)
- [Site Map](https://www.minitab.com/en-us/site-map/)
- [](https://www.linkedin.com/company/minitab/)
- [](https://www.facebook.com/Minitab/)
- [](https://www.youtube.com/user/MinitabInc)
- [](https://www.instagram.com/minitab/)
---
© 2025 Minitab, LLC. All Rights Reserved.
- [Terms of Use](https://www.minitab.com/en-us/legal/terms-of-use/)
- [Privacy Policy](https://www.minitab.com/en-us/legal/privacy-policy/)
- [Legal](https://www.minitab.com/en-us/legal/)
- Cookies Settings