---
title: Exploring Healthcare Data, Part 1
description: Exploring Healthcare Data, Part 1
image: https://blog.minitab.com/hubfs/B2BML%20-%20NEW%20FILE%20MANAGER%20STRUCTURE/Blog%20Images/Imported_Blog_Media/atp_test-3.jpg
---
English
- [English](https://blog.minitab.com/en/?hsLang=en)
- [Français](https://blog.minitab.com/fr/?hsLang=en)
- [Deutsch](https://blog.minitab.com/de/?hsLang=en)
- [Português](https://blog.minitab.com/pt/?hsLang=en)
- [Español](https://blog.minitab.com/es/?hsLang=en)
- [日本語](https://blog.minitab.com/ja/?hsLang=en)
- [한국어](https://blog.minitab.com/ko/?hsLang=en)
- [中文(简体)](https://blog.minitab.com/zh/?hsLang=en)
- [ Partners](https://www.minitab.com/en-us/company/partners/)
- [ Contact](https://www.minitab.com/en-us/company/contact-us/)
- [ Talk to Minitab](https://www.minitab.com/en-us/talk-to-minitab/)
- [ My Account](https://licensing.minitab.com/account/manage)
[](https://www.minitab.com/en-us/)
- Products
Back
[Products](https://www.minitab.com/en-us/products/)
[All Products](https://www.minitab.com/en-us/products/)
- [Minitab Solution Center](https://www.minitab.com/en-us/products/minitab-solution-center/)
- [Minitab Statistical Software](https://www.minitab.com/en-us/products/minitab/)
- [Minitab Connect](https://www.minitab.com/en-us/products/connect/)
- [Minitab Model Ops](https://www.minitab.com/en-us/products/model-ops/)
- [Minitab Education Hub](https://www.minitab.com/en-us/products/education-hub/)
- [Minitab Engage](https://www.minitab.com/en-us/products/engage/)
- [Minitab Workspace](https://www.minitab.com/en-us/products/workspace/)
- [Real-Time SPC](https://www.minitab.com/en-us/products/real-time-spc/)
- [Prolink Data Collection & SPC](https://www.minitab.com/en-us/products/prolink)
- [Simul8 Discrete Event Simulation](https://info.minitab.com/en/new-to-simul8?hsLang=en)
- [SPM](https://www.minitab.com/en-us/products/spm/)
- Solutions
Back
[Solutions](https://www.minitab.com/en-us/solutions/)
[All Solutions](https://www.minitab.com/en-us/solutions/)
- [Analytics](https://www.minitab.com/en-us/solutions/analytics/)
- [Statistics & Predictive Analytics](https://www.minitab.com/en-us/solutions/analytics/statistical-analysis-predictive-analytics/)
- [Data Science & Machine Learning](https://www.minitab.com/en-us/solutions/analytics/data-science-machine-learning/)
- [Business Analytics & Intelligence](https://www.minitab.com/en-us/solutions/analytics/business-analytics-intelligence/)
- [Statistical Process Control](https://www.minitab.com/en-us/solutions/analytics/statistical-process-control/)
- [Quality Analytics](https://www.minitab.com/en-us/solutions/analytics/quality-analytics/)
- [Live Analytics](https://www.minitab.com/en-us/solutions/analytics/live-analytics/)
- [Reliability & Life Data Analysis](https://www.minitab.com/en-us/solutions/analytics/reliability/)
- [Discrete Event Simulation](https://info.minitab.com/en/new-to-simul8?hsLang=en)
- [Process Mining](https://info.minitab.com/en/new-to-simul8?hsLang=en)
- [Key Capabilities](https://www.minitab.com/en-us/solutions/key-capabilities/)
- [Continuous Improvement](https://www.minitab.com/en-us/solutions/key-capabilities/continuous-improvement/)
- [Data Integration & Data Prep](https://www.minitab.com/en-us/solutions/key-capabilities/data-integration-data-prep/)
- [Diagramming & Mind Mapping](https://www.minitab.com/en-us/solutions/key-capabilities/diagramming-mind-mapping/)
- [Digital Twins](https://info.minitab.com/en/new-to-simul8?hsLang=en)
- [Model Deployment & ML Ops](https://www.minitab.com/en-us/solutions/key-capabilities/model-deployment-ml-ops/)
- [Innovation & Project Management](https://www.minitab.com/en-us/solutions/key-capabilities/innovation-project-management/)
- [Process Excellence: Detect, Correct & Prevent](https://www.minitab.com/en-us/solutions/key-capabilities/process-excellence/)
- [Featured Industries](https://www.minitab.com/en-us/solutions/industry/)
- [Academic](https://www.minitab.com/en-us/solutions/industry/academic/)
- [Energy & Natural Resources](https://www.minitab.com/en-us/solutions/industry/energy-resources/)
- [Government & Public Sector](https://www.minitab.com/en-us/solutions/industry/government/)
- [Healthcare](https://www.minitab.com/en-us/solutions/industry/healthcare/)
- [Insurance](https://www.minitab.com/en-us/solutions/industry/insurance/)
- [Manufacturing & Industrial](https://www.minitab.com/en-us/solutions/industry/manufacturing-industrial/)
- [Services](https://www.minitab.com/en-us/solutions/industry/service-industries/)
- [Software & Technology](https://www.minitab.com/en-us/solutions/industry/software-technology/)
- [Construction](https://www.minitab.com/en-us/solutions/industry/construction/)
- [Featured Roles](https://www.minitab.com/en-us/solutions/role/)
- [Engineering](https://www.minitab.com/en-us/solutions/role/engineering/)
- [Business Analysis](https://www.minitab.com/en-us/solutions/role/business-analysts/)
- [Information Technology](https://www.minitab.com/en-us/solutions/role/information-technology/)
- [Supply Chain](https://www.minitab.com/en-us/solutions/role/supply-chain/)
- [Customer Service & Contact Center](https://www.minitab.com/en-us/solutions/role/customer-service-contact-center/)
- [Human Resources](https://www.minitab.com/en-us/solutions/role/human-resources/)
- [Marketing](https://www.minitab.com/en-us/solutions/role/marketing/)
- [Research and Development](https://www.minitab.com/en-us/solutions/role/research-and-development/)
- Resources & Services
Back
[Resources & Services](https://www.minitab.com/en-us/resources-services/)
[All Resources & Services](https://www.minitab.com/en-us/resources-services/)
- [Resources](https://www.minitab.com/en-us/resources-services/resources/)
- [Case Studies](https://www.minitab.com/en-us/resources-services/resources/case-studies/)
- [eBooks & White Papers](https://www.minitab.com/en-us/resources-services/resources/ebooks-and-white-papers/)
- [Blog](https://blog.minitab.com/blog/?hsLang=en)
- [Data Sets](https://www.minitab.com/en-us/resources-services/resources/data-set/)
- [Webinars & Events](https://www.minitab.com/en-us/resources-services/resources/events/)
- [Education Hub](https://www.minitab.com/en-us/resources-services/resources/education-hub/)
- [Services](https://www.minitab.com/en-us/resources-services/services/)
- [Training](https://www.minitab.com/en-us/resources-services/services/training/)
- [Deployment](https://www.minitab.com/en-us/resources-services/services/deployment/)
- [Consulting](https://www.minitab.com/en-us/resources-services/services/statistical-consulting/)
- [Self-Paced Learning](https://www.minitab.com/en-us/resources-services/services/self-paced-learning/)
- [Continuing Education](https://www.minitab.com/en-us/resources-services/services/continuing-education/)
- Support
Back
[Support](https://www.minitab.com/en-us/support/)
[Technical Support](https://www.minitab.com/en-us/support/)
- [Subscriptions & Activation](https://www.minitab.com/en-us/support/subscriptions-and-activation/)
- [Minitab Quick Start](https://www.minitab.com/en-us/support/quick-start/)
- [Training](https://www.minitab.com/en-us/resources-services/services/training/)
- [Installation Support](https://www.minitab.com/en-us/support/installation/)
- [Support Videos](https://www.minitab.com/en-us/support/videos/)
- [Support Documentation](https://www.minitab.com/en-us/support/documents/)
- [Software Updates](https://www.minitab.com/en-us/support/software-updates/)
- [Product Downloads](https://www.minitab.com/en-us/support/downloads/)
- [Support Policy](https://www.minitab.com/en-us/support/policy/)
- Company
Back
[Company](https://www.minitab.com/en-us/company/)
[Company](https://www.minitab.com/en-us/company/)
- [About Us](https://www.minitab.com/en-us/company/our-company/)
- [Leadership Team](https://www.minitab.com/en-us/company/leadership-team/)
- [Partners](https://www.minitab.com/en-us/company/partners/)
- [Careers](https://www.minitab.com/en-us/company/careers/)
- [Contact](https://www.minitab.com/en-us/company/contact-us/)
- [News](https://www.minitab.com/en-us/company/press-releases/)
[Try/Buy](https://www.minitab.com/en-us/try-buy/)
- [Statistics](https://blog.minitab.com/en/blog/tag/statistics)
- [Data Analysis](https://blog.minitab.com/en/blog/tag/data-analysis)
-
- [Quality Improvement](https://blog.minitab.com/en/blog/tag/quality-improvement)
- [Subscribe](https://info.minitab.com/blog/subscribe?hsLang=en)

## Notice
You are now leaving minitab.com.
Click Continue to proceed to:
Continue
Go Back
# Exploring Healthcare Data, Part 1
Minitab Guest Blogger | 5/2/2016
Topics: [Healthcare](https://blog.minitab.com/en/blog/tag/healthcare), [Data Analysis](https://blog.minitab.com/en/blog/tag/data-analysis), [Six Sigma](https://blog.minitab.com/en/blog/tag/six-sigma)
- [Share](https://www.linkedin.com/shareArticle?mini=true&url=https://blog.minitab.com/en/blog/meredith-griffith/exploring-healthcare-data-part-1)
- [Share](https://www.facebook.com/sharer.php?u=https://blog.minitab.com/en/blog/meredith-griffith/exploring-healthcare-data-part-1)
Working with healthcare-related data often feels different than working with manufacturing data. After all, the common thread among healthcare quality improvement professionals is the motivation to preserve and improve the lives of patients. Whether collecting data on the number of patient falls, patient length-of-stay, bed unavailability, wait times, hospital acquired-infections, or readmissions, human lives are stake. And so collecting and analyzing data—and trusting your results—in a healthcare setting feels even more critical.
Because delivering quality care efficiently is of utmost importance in the healthcare industry, understanding your process, collecting data around that process, and knowing what analysis to perform is key. Awareness about your process and opportunities to improve patient care and cut costs will benefit from using data to drive decisions in your organization that will result in better business and better care.
So, in the interest of using data to draw insights and make decisions that have positive impacts, I’d like to offer several tips for exploring and visualizing your healthcare data in a way that will prepare you for a formal analysis. For instance, graphing your data and examining descriptive statistics such as means and medians can tell you a lot about [how your data are distributed](https://blog.minitab.com/blog/michelle-paret/3-things-a-histogram-can-tell-you?hsLang=en) and can help you visualize relationships between variables. These preliminary explorations can also reveal unusual observations in your data that should be investigated before you perform a more sophisticated statistical analysis, allowing you to take action quickly when a process, outcome, or adverse event needs attention.
In the first part of this series, I’ll offer two tips on exploring and visualizing data with graphs, brushing, and conditional formatting. In part 2, I’ll offer three more tips focusing on data manipulation and obtaining descriptive statistics.
If you’d like to follow along, you can [download and explore the data](https://blog.minitab.com/hubfs/ATP_CatchUp.mtw?hsLang=en)yourself! If you don’t yet have Minitab Statistical Software, you can download the [free trial](http://www.minitab.com/products/minitab/free-trial/).
## A Case Study: Ensuring Sound Sanitization Procedures
Let’s look at a case study where a hospital was seeking to examine—and ultimately improve—their room cleaning procedures.
The presence of adenosine triphosphate (ATP) on a surface indicates that bacteria exists. Hospitals can use ATP detection systems to ensure the effectiveness of their sanitization efforts and identify improvement opportunities.
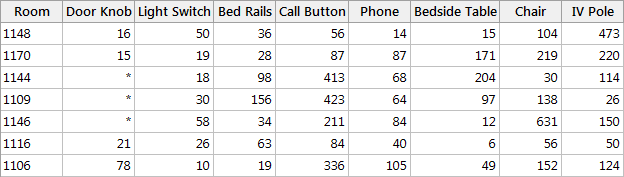
Staff at your hospital used ATP swab tests to test 8 surfaces in 10 different hospital rooms across 5 departments, and recorded the results in a data sheet. ATP measurements below 400 units ‘pass’ the swab test, while measurements greater than or equal to 400 units ‘fail’ the swab test and require further investigation.
Here is a screenshot of part of the worksheet:
## Tip #1: Evaluate the shape of your data
You can use a histogram to graph all eight surfaces that were tested in separate panels of the same graph. This helps you observe and compare the distribution of data across each touch point.
If you’ve downloaded the [data](https://blog.minitab.com/hubfs/ATP_CatchUp.mtw?hsLang=en), you can use the **ATP\_CatchUp.MTW** worksheet to create this same histogram by navigating to **Graph > Histogram > Simple**. In the **Graph Variables** window, select Door Knob, Light Switch, Bed Rails, Call Button, Phone, Bedside Table, Chair, and IV Pole. Click on the **Multiple Graphs** subdialog and select *In separate panels of the same graph* under **Show Graph Variables.** Click **OK** through all dialogs.
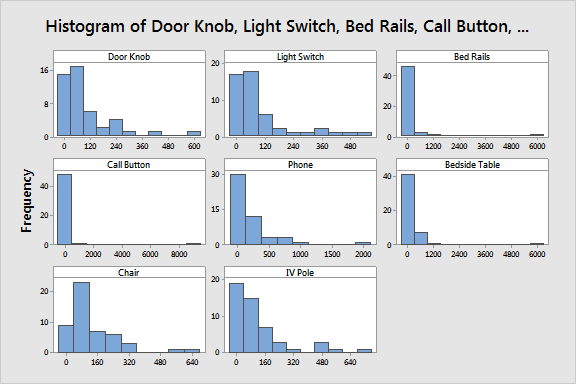
These histograms reveal that:
- For all test areas, the distribution is asymmetrical with some extreme outliers.
- Data are all right-skewed.
- Data do not appear to be normally distributed.
## Tip #2: Identify and investigate outliers
An individual value plot can be used to graph the ATP measurements collected across all eight surfaces. Identifying the outliers is quite easy with this plot.
And again, you can use the **ATP\_CatchUp.MTW** worksheet to create an individual value plot that looks just like mine. Navigate to **Graph > Individual Value Plots > Multiple Y’s > Simple,** and choose Door Knob, Light Switch, Bed Rails, Call Button, Phone, Bedside Table, Chair, and IV Pole as **Graph variables**. Click **OK**.
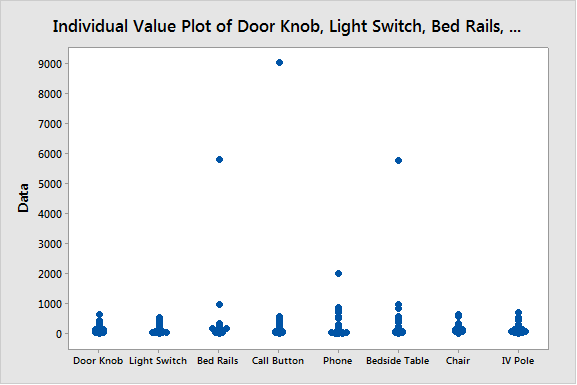
This individual value plot reveals that:
- Extreme outliers are present for ATP measurements on Bed Rails, Call Button, Phone, and Bedside Table.
- These extreme values are influencing the mean ATP measured for each surface.
- It may be more helpful to analyze differences in medians since the means are skewed by these outliers (judging by the histogram and individual value plot).
Once the outliers are identified, you can investigate them with Minitab’s brushing tool to uncover more insights by right-clicking anywhere in the individual value plot and selecting **Brush Points**. Click and drag the cursor to form a rectangle around the outliers as shown below. Setting ID variables also helps to reveal information about other variables associated with these outliers. To do this, right-click in the highlighted rectangle again and select **Set ID Variables.** Enter Room as the **Variable** and click **OK. **
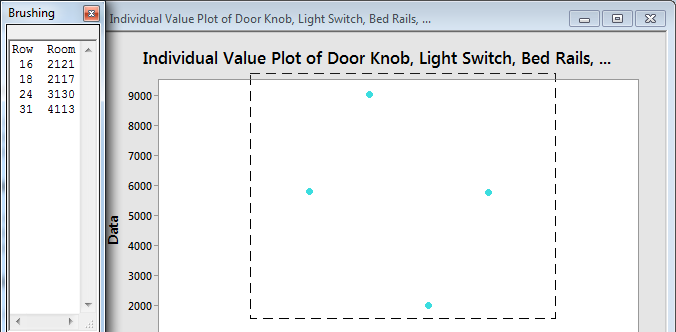
Brushing can provide actionable insights:
- Brushing the extreme outliers on the individual value plot and setting ID variables reveals the room numbers associated with high ATP measurements.
- Quickly identifying rooms where surfaces have high levels of ATP enables faster follow-up and investigation on specific surfaces in specific rooms.
Finally, you can use conditional formatting and other cell properties to investigate and make notes about the outliers. To look at outliers across all surfaces tested, highlight columns C2 through C9, right-click in the worksheet, and select **Conditional Formatting > Statistical > Outlier**. Alternatively, you can highlight only the extreme outliers by right-clicking in the worksheet, selecting **Conditional Formatting > Highlight Cell > Greater Than** and entering 2000 (a value we know extreme outliers are above based on the individual value plot).
To make notes about individual outliers, right-click on the cell containing the extreme value, select **Cell Properties > Comment**, and enter your cell comment.
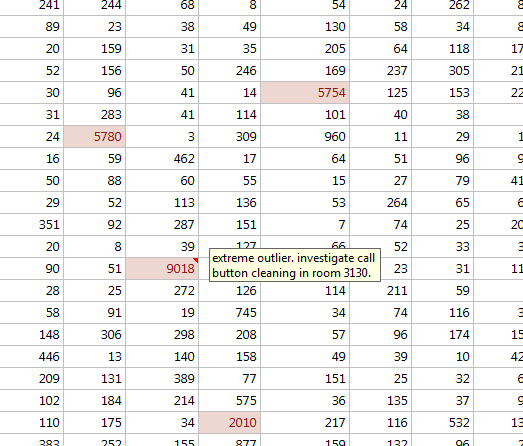
Conditional formats and cell properties offer:
- Quick insight into surfaces and rooms with high ATP measurements.
- More efficient investigation of problem areas in order to make process improvements.
## Visualizations that Lead to Actionable Insights
By exploring and visualizing your data in these preliminary ways, you can see how easy it is to draw conclusions before even doing an analysis. The data is not normally distributed but is highly skewed by several extreme outliers, which greatly influence the mean ATP measurement recorded for each surface. The first graph created to visualize the data is helpful evidence that comparing medians instead of means may be a more effective way to determine if statistically significant differences exist across surfaces. Investigating these outliers both graphically and in the worksheet offers further evidence that analyzing differences in median measurements will be most effective. It is also obvious that bed rails, call buttons, phones, and bedside tables are highly contaminated surfaces—one might surmise this is because of the touch points’ close proximity to sick patients, and the frequency with which patients come into contact with these surfaces.
You can use these insights to focus our initial process improvement efforts on the most problematic touch points and hospital rooms. In part 2 of this blog post, I’ll share some [tips for manipulating data, extracting even more information from the data, and displaying descriptive statistics](https://blog.minitab.com/blog/meredith-griffith/exploring-healthcare-data-part-2?hsLang=en) about contamination levels.
## You Might Also Like
[New Minitab Updates Unite Data Collection, Preparation, and Predictive Analytics](https://blog.minitab.com/en/blog/new-minitab-updates-unite-data-collection-preparation-and-predictive-analytics?hsLang=en)
[Data Preparation](https://blog.minitab.com/en/blog/tag/data-preparation) | 5 Minute Read
[Artemis II Heat Shield: How Do You Decide in Uncertain Conditions?](https://blog.minitab.com/en/blog/artemis-ii-heat-shield-how-do-you-decide-under-uncertainty?hsLang=en)
[Data Analysis](https://blog.minitab.com/en/blog/tag/data-analysis) | 4 Minute Read
[6 Trends Shaping Business Decisions in 2026](https://blog.minitab.com/en/blog/6-trends-shaping-business-decisions-in-2026?hsLang=en)
[Oee](https://blog.minitab.com/en/blog/tag/oee) | 8 Minute Read
---
- [Careers](https://www.minitab.com/en-us/company/careers/)
- [Trust Center](https://www.minitab.com/en-us/trust-center/)
- [Suppliers](https://www.minitab.com/en-us/suppliers/)
- [Site Map](https://www.minitab.com/en-us/site-map/)
- [](https://www.linkedin.com/company/minitab/)
- [](https://www.facebook.com/Minitab/)
- [](https://www.youtube.com/user/MinitabInc)
- [](https://www.instagram.com/minitab/)
---
© 2025 Minitab, LLC. All Rights Reserved.
- [Terms of Use](https://www.minitab.com/en-us/legal/terms-of-use/)
- [Privacy Policy](https://www.minitab.com/en-us/legal/privacy-policy/)
- [Legal](https://www.minitab.com/en-us/legal/)
- Cookies Settings