---
title: "Methods and Formulas: How Are I-MR Chart Control Limits Calculated?"
description: "Methods and Formulas: How Are I-MR Chart Control Limits Calculated?"
image: https://blog.minitab.com/hubfs/B2BML%20-%20NEW%20FILE%20MANAGER%20STRUCTURE/Blog%20Images/Imported_Blog_Media/pic1-16-Jul-06-2025-12-53-55-4513-AM.png
---
English
- [English](https://blog.minitab.com/en/?hsLang=en)
- [Français](https://blog.minitab.com/fr/?hsLang=en)
- [Deutsch](https://blog.minitab.com/de/?hsLang=en)
- [Português](https://blog.minitab.com/pt/?hsLang=en)
- [Español](https://blog.minitab.com/es/?hsLang=en)
- [日本語](https://blog.minitab.com/ja/?hsLang=en)
- [한국어](https://blog.minitab.com/ko/?hsLang=en)
- [中文(简体)](https://blog.minitab.com/zh/?hsLang=en)
- [ Partners](https://www.minitab.com/en-us/company/partners/)
- [ Contact](https://www.minitab.com/en-us/company/contact-us/)
- [ Talk to Minitab](https://www.minitab.com/en-us/talk-to-minitab/)
- [ My Account](https://licensing.minitab.com/account/manage)
[](https://www.minitab.com/en-us/)
- Products
Back
[Products](https://www.minitab.com/en-us/products/)
[All Products](https://www.minitab.com/en-us/products/)
- [Minitab Solution Center](https://www.minitab.com/en-us/products/minitab-solution-center/)
- [Minitab Statistical Software](https://www.minitab.com/en-us/products/minitab/)
- [Minitab Connect](https://www.minitab.com/en-us/products/connect/)
- [Minitab Model Ops](https://www.minitab.com/en-us/products/model-ops/)
- [Minitab Education Hub](https://www.minitab.com/en-us/products/education-hub/)
- [Minitab Engage](https://www.minitab.com/en-us/products/engage/)
- [Minitab Workspace](https://www.minitab.com/en-us/products/workspace/)
- [Real-Time SPC](https://www.minitab.com/en-us/products/real-time-spc/)
- [Prolink Data Collection & SPC](https://www.minitab.com/en-us/products/prolink)
- [Simul8 Discrete Event Simulation](https://info.minitab.com/en/new-to-simul8?hsLang=en)
- [SPM](https://www.minitab.com/en-us/products/spm/)
- Solutions
Back
[Solutions](https://www.minitab.com/en-us/solutions/)
[All Solutions](https://www.minitab.com/en-us/solutions/)
- [Analytics](https://www.minitab.com/en-us/solutions/analytics/)
- [Statistics & Predictive Analytics](https://www.minitab.com/en-us/solutions/analytics/statistical-analysis-predictive-analytics/)
- [Data Science & Machine Learning](https://www.minitab.com/en-us/solutions/analytics/data-science-machine-learning/)
- [Business Analytics & Intelligence](https://www.minitab.com/en-us/solutions/analytics/business-analytics-intelligence/)
- [Statistical Process Control](https://www.minitab.com/en-us/solutions/analytics/statistical-process-control/)
- [Quality Analytics](https://www.minitab.com/en-us/solutions/analytics/quality-analytics/)
- [Live Analytics](https://www.minitab.com/en-us/solutions/analytics/live-analytics/)
- [Reliability & Life Data Analysis](https://www.minitab.com/en-us/solutions/analytics/reliability/)
- [Discrete Event Simulation](https://info.minitab.com/en/new-to-simul8?hsLang=en)
- [Process Mining](https://info.minitab.com/en/new-to-simul8?hsLang=en)
- [Key Capabilities](https://www.minitab.com/en-us/solutions/key-capabilities/)
- [Continuous Improvement](https://www.minitab.com/en-us/solutions/key-capabilities/continuous-improvement/)
- [Data Integration & Data Prep](https://www.minitab.com/en-us/solutions/key-capabilities/data-integration-data-prep/)
- [Diagramming & Mind Mapping](https://www.minitab.com/en-us/solutions/key-capabilities/diagramming-mind-mapping/)
- [Digital Twins](https://info.minitab.com/en/new-to-simul8?hsLang=en)
- [Model Deployment & ML Ops](https://www.minitab.com/en-us/solutions/key-capabilities/model-deployment-ml-ops/)
- [Innovation & Project Management](https://www.minitab.com/en-us/solutions/key-capabilities/innovation-project-management/)
- [Process Excellence: Detect, Correct & Prevent](https://www.minitab.com/en-us/solutions/key-capabilities/process-excellence/)
- [Featured Industries](https://www.minitab.com/en-us/solutions/industry/)
- [Academic](https://www.minitab.com/en-us/solutions/industry/academic/)
- [Energy & Natural Resources](https://www.minitab.com/en-us/solutions/industry/energy-resources/)
- [Government & Public Sector](https://www.minitab.com/en-us/solutions/industry/government/)
- [Healthcare](https://www.minitab.com/en-us/solutions/industry/healthcare/)
- [Insurance](https://www.minitab.com/en-us/solutions/industry/insurance/)
- [Manufacturing & Industrial](https://www.minitab.com/en-us/solutions/industry/manufacturing-industrial/)
- [Services](https://www.minitab.com/en-us/solutions/industry/service-industries/)
- [Software & Technology](https://www.minitab.com/en-us/solutions/industry/software-technology/)
- [Construction](https://www.minitab.com/en-us/solutions/industry/construction/)
- [Featured Roles](https://www.minitab.com/en-us/solutions/role/)
- [Engineering](https://www.minitab.com/en-us/solutions/role/engineering/)
- [Business Analysis](https://www.minitab.com/en-us/solutions/role/business-analysts/)
- [Information Technology](https://www.minitab.com/en-us/solutions/role/information-technology/)
- [Supply Chain](https://www.minitab.com/en-us/solutions/role/supply-chain/)
- [Customer Service & Contact Center](https://www.minitab.com/en-us/solutions/role/customer-service-contact-center/)
- [Human Resources](https://www.minitab.com/en-us/solutions/role/human-resources/)
- [Marketing](https://www.minitab.com/en-us/solutions/role/marketing/)
- [Research and Development](https://www.minitab.com/en-us/solutions/role/research-and-development/)
- Resources & Services
Back
[Resources & Services](https://www.minitab.com/en-us/resources-services/)
[All Resources & Services](https://www.minitab.com/en-us/resources-services/)
- [Resources](https://www.minitab.com/en-us/resources-services/resources/)
- [Case Studies](https://www.minitab.com/en-us/resources-services/resources/case-studies/)
- [eBooks & White Papers](https://www.minitab.com/en-us/resources-services/resources/ebooks-and-white-papers/)
- [Blog](https://blog.minitab.com/blog/?hsLang=en)
- [Data Sets](https://www.minitab.com/en-us/resources-services/resources/data-set/)
- [Webinars & Events](https://www.minitab.com/en-us/resources-services/resources/events/)
- [Education Hub](https://www.minitab.com/en-us/resources-services/resources/education-hub/)
- [Services](https://www.minitab.com/en-us/resources-services/services/)
- [Training](https://www.minitab.com/en-us/resources-services/services/training/)
- [Deployment](https://www.minitab.com/en-us/resources-services/services/deployment/)
- [Consulting](https://www.minitab.com/en-us/resources-services/services/statistical-consulting/)
- [Self-Paced Learning](https://www.minitab.com/en-us/resources-services/services/self-paced-learning/)
- [Continuing Education](https://www.minitab.com/en-us/resources-services/services/continuing-education/)
- Support
Back
[Support](https://www.minitab.com/en-us/support/)
[Technical Support](https://www.minitab.com/en-us/support/)
- [Subscriptions & Activation](https://www.minitab.com/en-us/support/subscriptions-and-activation/)
- [Minitab Quick Start](https://www.minitab.com/en-us/support/quick-start/)
- [Training](https://www.minitab.com/en-us/resources-services/services/training/)
- [Installation Support](https://www.minitab.com/en-us/support/installation/)
- [Support Videos](https://www.minitab.com/en-us/support/videos/)
- [Support Documentation](https://www.minitab.com/en-us/support/documents/)
- [Software Updates](https://www.minitab.com/en-us/support/software-updates/)
- [Product Downloads](https://www.minitab.com/en-us/support/downloads/)
- [Support Policy](https://www.minitab.com/en-us/support/policy/)
- Company
Back
[Company](https://www.minitab.com/en-us/company/)
[Company](https://www.minitab.com/en-us/company/)
- [About Us](https://www.minitab.com/en-us/company/our-company/)
- [Leadership Team](https://www.minitab.com/en-us/company/leadership-team/)
- [Partners](https://www.minitab.com/en-us/company/partners/)
- [Careers](https://www.minitab.com/en-us/company/careers/)
- [Contact](https://www.minitab.com/en-us/company/contact-us/)
- [News](https://www.minitab.com/en-us/company/press-releases/)
[Try/Buy](https://www.minitab.com/en-us/try-buy/)
- [Statistics](https://blog.minitab.com/en/blog/tag/statistics)
- [Data Analysis](https://blog.minitab.com/en/blog/tag/data-analysis)
-
- [Quality Improvement](https://blog.minitab.com/en/blog/tag/quality-improvement)
- [Subscribe](https://info.minitab.com/blog/subscribe?hsLang=en)

## Notice
You are now leaving minitab.com.
Click Continue to proceed to:
Continue
Go Back
# Methods and Formulas: How Are I-MR Chart Control Limits Calculated?
Minitab Blog Editor | 5/18/2017
Topics: [Data Analysis](https://blog.minitab.com/en/blog/tag/data-analysis), [Statistics](https://blog.minitab.com/en/blog/tag/statistics), [Quality Improvement](https://blog.minitab.com/en/blog/tag/quality-improvement), [Control Charts](https://blog.minitab.com/en/blog/tag/control-charts)
- [Share](https://www.linkedin.com/shareArticle?mini=true&url=https://blog.minitab.com/en/blog/methods-and-formulas3a-how-are-i-mr-chart-control-limits-calculated)
- [Share](https://www.facebook.com/sharer.php?u=https://blog.minitab.com/en/blog/methods-and-formulas3a-how-are-i-mr-chart-control-limits-calculated)
Users often contact Minitab technical support to ask how the software calculates the control limits on control charts.
A frequently asked question is how the control limits are calculated on an [I-MR Chart or Individuals Chart](https://blog.minitab.com/blog/understanding-statistics/how-create-and-read-an-i-mr-control-chart?hsLang=en). If Minitab plots the upper and lower control limits (UCL and LCL) three standard deviations above and below the mean, why are the limits plotted at values other than 3 times the standard deviation that I get using **Stat \> Basic Statistics**?
That’s a valid question—if we’re plotting individual points on the I-Chart, it doesn’t seem unreasonable to try to calculate a simple standard deviation of the data points, multiply by 3 and expect the UCL and LCL to be the data mean plus or minus 3 standard deviations. This can be especially confusing because the Mean line on the Individuals chart IS the mean of the data!
However, the standard deviation that Minitab [Statistical Software](http://www.minitab.com/products/minitab) uses is not the simple standard deviation of the data. The default method that Minitab uses (and an option to change the method) is available by clicking the I-MR Options button, and then choosing the Estimate tab:
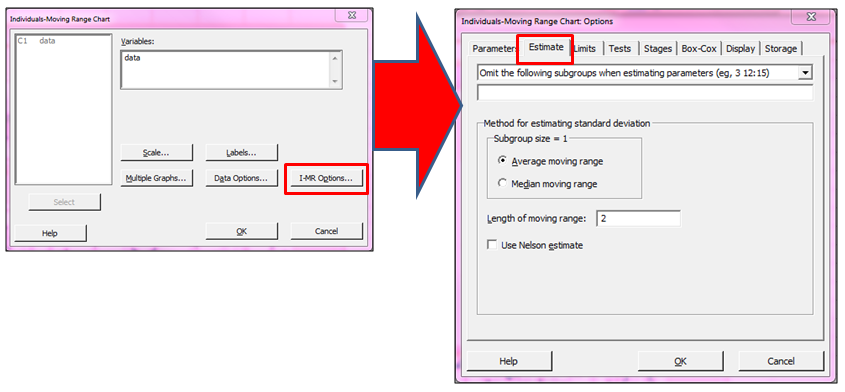
There we can see that Minitab is using the **Average moving range** method with **2** as the **length of moving range** to estimate the standard deviation.
That’s all well and good, but exactly what the heck is an average moving range with length 2?!
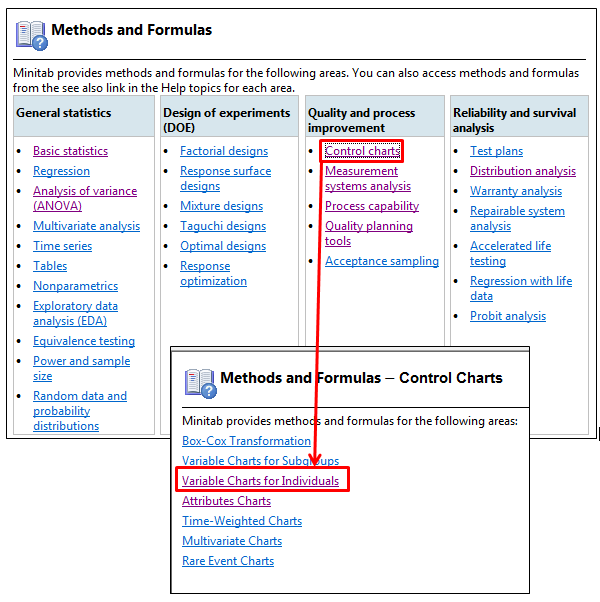
Minitab’s **Methods and Formulas** section details the formulas used for these calculations. In fact, Methods and formulas provides information on formulas used for all the calculations available through the dialog boxes: This information can be accessed via the Help menu, by choosing **Help** \> **Methods and Formulas...**
Too see the formulas for control chart calculations, we choose **Control Charts** \> **Variables Charts for Individuals** as shown below:
The next page shows the formulas organized by topic. By selecting the link **Methods for estimating standard deviation** we find the formula for the **Average moving range**:
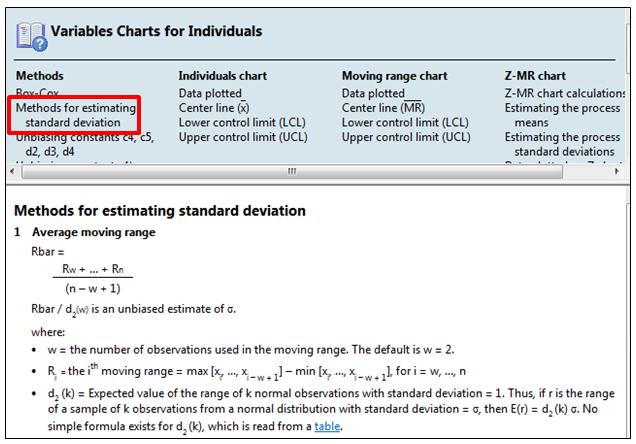
Looking at the formula, things become a bit clearer—the ‘length of the moving range’ is the number of data points used when we calculate the moving range (i.e., the difference from point 1 to point 2, 2 to 3, and so forth).
If we want to hand-calculate the control limits for a dataset, we can do that with a little help from Minitab!
The dataset I’ve used for this example is available [HERE](https://cdn2.content.compendiumblog.com/uploads/user/458939f4-fe08-4dbc-b271-efca0f5a2682/f6d0da32-ba1d-41d4-ace1-af34dcb51351/File/739bad1756df6628d4142b54711fb77c/data.MTW).
First, we’ll need to get the values of the moving ranges. We’ll use the calculator by navigating to **Calc** \> **Calculator;** in the example below, we’re storing the results in column C2 (an empty column) and we’re using the **LAG** function in the calculator. That will move each of our values in column C1 down by 1 row. Click **OK** to store the results in the worksheet.
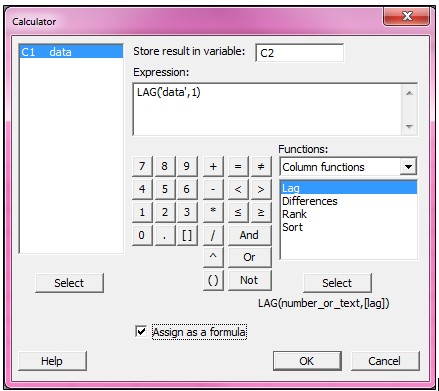
Note: By choosing the **Assign as a formula** option at the bottom of the calculator, we can add a formula to column C2 which we can easily go back and edit if a mistake was made.
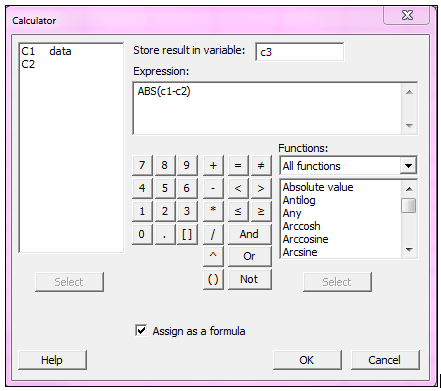
Now with the lags stored in C2, we use the calculator again: **Calc** \> **Calculator** (here's a tip: press F3 on the keyboard to clear out the previous calculator entry), then subtract column C2 from column C1 as shown below, storing the results in C3. We use the **ABS** calculator command to get the absolute differences of each row:
Next we calculate the sum of the absolute value of the moving ranges by using **Calc** \> **Calculator** once again. We’ll store the sum in the next empty column, C4:
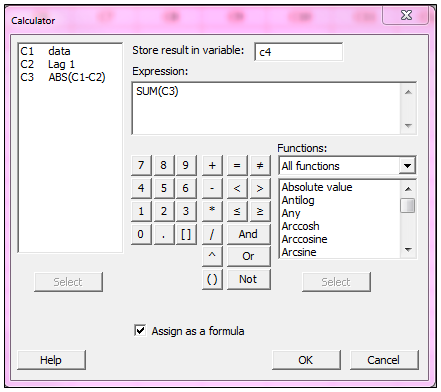
The value of this sum represents the numerator in the Rbar calculation:

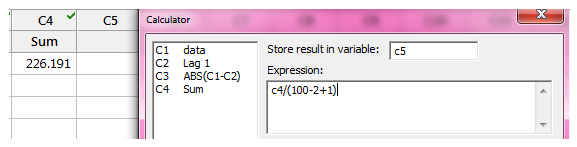
To complete the Rbar calculation, we use the information from Methods and Formulas to come up with the denominator; n is the number of data points (in this example it’s 100), w’s default value is 2 ,and we add 1, so the denominator is **100-2+1**. In Minitab, we can once again use **Calc** \> **Calculator** to store the results in C5:
With Rbar calculated, we find the value of the unbiasing constant d2 from the table that is linked in Methods and Formulas:
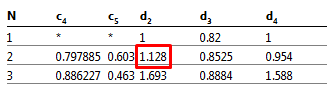
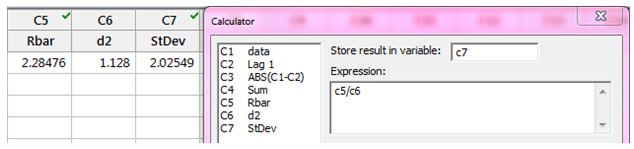
For a moving-range of length 2, the d2 value is 1.128, so we enter 1.128 in the first row in column C6, and use the calculator one more time to divide Rbar by d2 to get the standard deviation, which works out to be 2.02549:
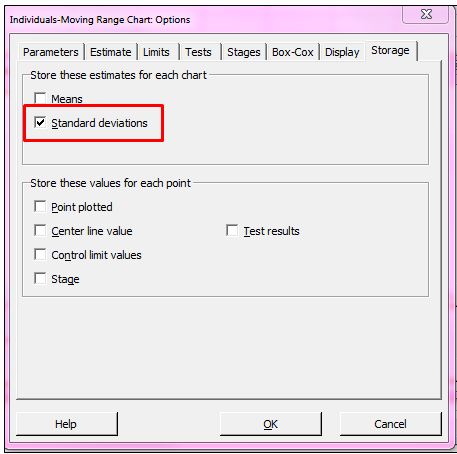
We can check our results by using the original data to create an I-MR chart. We enter the **data** column in **Variables**, and then click **I-MR Options** and choose the **Storage** tab; here we can tell Minitab to store the standard deviation in the worksheet when we create the chart:
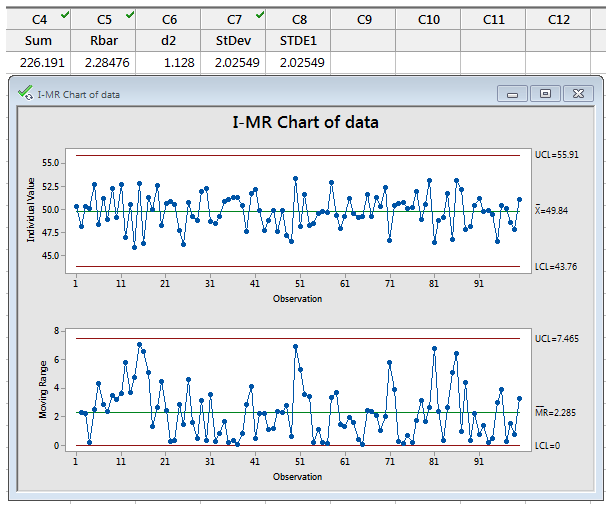
The stored standard deviation is shown in the new column titled STDE1, and it matched the value we hand-calculated. Notice also that the Rbar we calculated is the average of the moving ranges on the Moving-Range chart. Beautiful!
## You Might Also Like
[Understanding t-Tests: Why Degrees of Freedom Appeared in Minitab (and Why They Matter)](https://blog.minitab.com/en/blog/understanding-t-tests-why-degrees-of-freedom-appeared-in-minitab-and-why-they-matter?hsLang=en)
[Minitab Solution Center](https://blog.minitab.com/en/blog/tag/minitab-solution-center) | 5 Minute Read
[Which World Cup Quarterfinal Teams Look Most Like Past Champions?](https://blog.minitab.com/en/blog/which-world-cup-quarterfinal-teams-look-most-like-past-champions?hsLang=en)
[Minitab Solution Center](https://blog.minitab.com/en/blog/tag/minitab-solution-center) | 6 Minute Read
[New Minitab Updates Unite Data Collection, Preparation, and Predictive Analytics](https://blog.minitab.com/en/blog/new-minitab-updates-unite-data-collection-preparation-and-predictive-analytics?hsLang=en)
[Data Preparation](https://blog.minitab.com/en/blog/tag/data-preparation) | 5 Minute Read
---
- [Careers](https://www.minitab.com/en-us/company/careers/)
- [Trust Center](https://www.minitab.com/en-us/trust-center/)
- [Suppliers](https://www.minitab.com/en-us/suppliers/)
- [Site Map](https://www.minitab.com/en-us/site-map/)
- [](https://www.linkedin.com/company/minitab/)
- [](https://www.facebook.com/Minitab/)
- [](https://www.youtube.com/user/MinitabInc)
- [](https://www.instagram.com/minitab/)
---
© 2025 Minitab, LLC. All Rights Reserved.
- [Terms of Use](https://www.minitab.com/en-us/legal/terms-of-use/)
- [Privacy Policy](https://www.minitab.com/en-us/legal/privacy-policy/)
- [Legal](https://www.minitab.com/en-us/legal/)
- Cookies Settings