


A few years ago, I knew Minitab for just one thing: amazing statistical software that powered my OPEX and CI projects. What I didn’t realize back then was just how much more Minitab could help me, and the companies I worked for.
This is the fourth blog in my Garden Stats series, where I use low-stakes, easy-to-digest gardening metaphors to explain how Minitab solutions support real-world improvement. If you missed the first three, you can check them out here: Garden Stats Blogs 1, 2, and 3.
Planting the Seeds
Like many people, my wife and I picked up gardening during COVID. At first… let’s just say we weren’t winning any “Green Thumb of the Year” awards. But once we applied continuous improvement principles at home, just like we did at work, the results were clear. We not only improved, but we also figured out how to sustain those gains over time.
One of the most powerful tools for sustaining improvement? Process monitoring charts, also known as statistical process control (SPC) charts.
New Growth: Minitab + Prolink
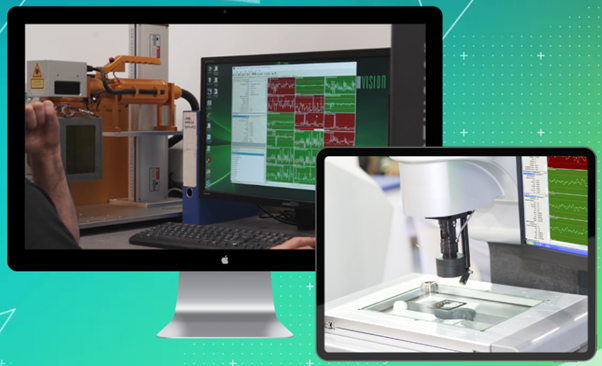
Even in 2025, Minitab continues to expand what’s possible with SPC. We recently acquired Prolink, which makes verifying your process or product incredibly simple with intuitive, color-coded control charts (green = good, yellow = out of control, red = out of spec).
Think about it: if my garden’s pH, moisture, and sunlight monitor could plug straight into Prolink, I’d see instant, colorful insights telling me exactly what’s happening—no guessing required!
This is especially powerful in manufacturing where CMMs and Optical Measurement Devices track hundreds of features at once. QC-CALC (part of Prolink’s suite) charts them automatically, giving operators feedback right where the work is being done. It’s no wonder my old companies relied on it so much! (Fun fact: my wife—also a Master Black Belt—and I used to talk about this while visiting a plant in Clyde, Ohio.)
👉 Explore Prolink Solutions Here
Smarter Gardens, Smarter Factories
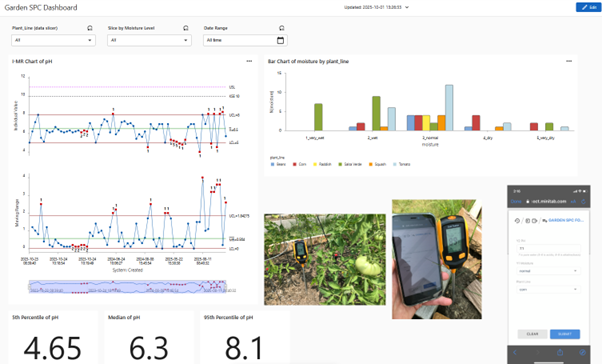
Minitab doesn’t stop at charts. With Minitab Connect, you can build web forms, collect data, run automated analysis, and even trigger alerts. If my garden’s moisture or pH levels drifted, the system could send me (or my wife!) a text telling us exactly what to do to save the veggies.
Here’s the cool part:
At first, our garden dashboard was simple:
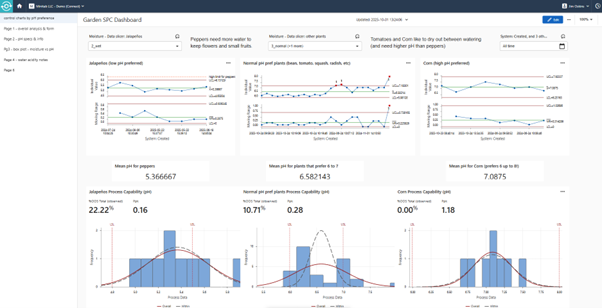
Over time, after learning and tweaking, it evolved into something truly powerful.
We even set up real-time email alerts anytime the garden “process” went out of control—so now we reliably hit our pepper production goals with zero scrap (only thriving plants).
That same magic works in factories: monitoring production lines, storing data automatically, and charting trends without manual effort.
Scaling Up: Real-Time SPC
While Minitab Connect is perfect for custom dashboards, Minitab Real-Time SPC takes things to the next level. Built on the same foundation, it’s designed for large-scale operations, with intuitive tools for managing thousands of metrics at once.
My favorite feature? A prioritized list that instantly shows the biggest issues, sorted by percent out-of-control or out-of-spec. It’s like giving manufacturers a spotlight on their most urgent problems—so they can fix them faster.
Wrapping Up
Over the past four Garden Stats blogs, I’ve shared the things I wish I knew as a Minitab customer:
- How to go beyond Phase 1 control charts.
- How Prolink gives you instant, color-coded feedback at the station.
- How Connect automates data collection and alerts (yes, even for peppers!).
- How Real-Time SPC scales these solutions across entire factories.
Just like my garden, growth takes work, monitoring, and the right tools. And now, Minitab has even more of them to help you thrive.
Thanks for growing with me this year—here’s to even better harvests ahead!
Best regards,
Jim
If You Would Like to Get More Hands-On Experience with Minitab, Sign Up for Training!
