---
title: Leaving Out-of-control Points Out of Control Chart Calculations Looks Hard, but It Isn't
description: Leaving Out-of-control Points Out of Control Chart Calculations Looks Hard, but It Isn't
image: https://blog.minitab.com/hubfs/B2BML%20-%20NEW%20FILE%20MANAGER%20STRUCTURE/Blog%20Images/Imported_Blog_Media/houston_skyline11-3.jpg
---
English
- [English](https://blog.minitab.com/en/?hsLang=en)
- [Français](https://blog.minitab.com/fr/?hsLang=en)
- [Deutsch](https://blog.minitab.com/de/?hsLang=en)
- [Português](https://blog.minitab.com/pt/?hsLang=en)
- [Español](https://blog.minitab.com/es/?hsLang=en)
- [日本語](https://blog.minitab.com/ja/?hsLang=en)
- [한국어](https://blog.minitab.com/ko/?hsLang=en)
- [中文(简体)](https://blog.minitab.com/zh/?hsLang=en)
- [ Partners](https://www.minitab.com/en-us/company/partners/)
- [ Contact](https://www.minitab.com/en-us/company/contact-us/)
- [ Talk to Minitab](https://www.minitab.com/en-us/talk-to-minitab/)
- [ My Account](https://licensing.minitab.com/account/manage)
[](https://www.minitab.com/en-us/)
- Products
Back
[Products](https://www.minitab.com/en-us/products/)
[All Products](https://www.minitab.com/en-us/products/)
- [Minitab Solution Center](https://www.minitab.com/en-us/products/minitab-solution-center/)
- [Minitab Statistical Software](https://www.minitab.com/en-us/products/minitab/)
- [Minitab Connect](https://www.minitab.com/en-us/products/connect/)
- [Minitab Model Ops](https://www.minitab.com/en-us/products/model-ops/)
- [Minitab Education Hub](https://www.minitab.com/en-us/products/education-hub/)
- [Minitab Engage](https://www.minitab.com/en-us/products/engage/)
- [Minitab Workspace](https://www.minitab.com/en-us/products/workspace/)
- [Real-Time SPC](https://www.minitab.com/en-us/products/real-time-spc/)
- [Prolink Data Collection & SPC](https://www.minitab.com/en-us/products/prolink)
- [Simul8 Discrete Event Simulation](https://info.minitab.com/en/new-to-simul8?hsLang=en)
- [SPM](https://www.minitab.com/en-us/products/spm/)
- Solutions
Back
[Solutions](https://www.minitab.com/en-us/solutions/)
[All Solutions](https://www.minitab.com/en-us/solutions/)
- [Analytics](https://www.minitab.com/en-us/solutions/analytics/)
- [Statistics & Predictive Analytics](https://www.minitab.com/en-us/solutions/analytics/statistical-analysis-predictive-analytics/)
- [Data Science & Machine Learning](https://www.minitab.com/en-us/solutions/analytics/data-science-machine-learning/)
- [Business Analytics & Intelligence](https://www.minitab.com/en-us/solutions/analytics/business-analytics-intelligence/)
- [Statistical Process Control](https://www.minitab.com/en-us/solutions/analytics/statistical-process-control/)
- [Quality Analytics](https://www.minitab.com/en-us/solutions/analytics/quality-analytics/)
- [Live Analytics](https://www.minitab.com/en-us/solutions/analytics/live-analytics/)
- [Reliability & Life Data Analysis](https://www.minitab.com/en-us/solutions/analytics/reliability/)
- [Discrete Event Simulation](https://info.minitab.com/en/new-to-simul8?hsLang=en)
- [Process Mining](https://info.minitab.com/en/new-to-simul8?hsLang=en)
- [Key Capabilities](https://www.minitab.com/en-us/solutions/key-capabilities/)
- [Continuous Improvement](https://www.minitab.com/en-us/solutions/key-capabilities/continuous-improvement/)
- [Data Integration & Data Prep](https://www.minitab.com/en-us/solutions/key-capabilities/data-integration-data-prep/)
- [Diagramming & Mind Mapping](https://www.minitab.com/en-us/solutions/key-capabilities/diagramming-mind-mapping/)
- [Digital Twins](https://info.minitab.com/en/new-to-simul8?hsLang=en)
- [Model Deployment & ML Ops](https://www.minitab.com/en-us/solutions/key-capabilities/model-deployment-ml-ops/)
- [Innovation & Project Management](https://www.minitab.com/en-us/solutions/key-capabilities/innovation-project-management/)
- [Process Excellence: Detect, Correct & Prevent](https://www.minitab.com/en-us/solutions/key-capabilities/process-excellence/)
- [Featured Industries](https://www.minitab.com/en-us/solutions/industry/)
- [Academic](https://www.minitab.com/en-us/solutions/industry/academic/)
- [Energy & Natural Resources](https://www.minitab.com/en-us/solutions/industry/energy-resources/)
- [Government & Public Sector](https://www.minitab.com/en-us/solutions/industry/government/)
- [Healthcare](https://www.minitab.com/en-us/solutions/industry/healthcare/)
- [Insurance](https://www.minitab.com/en-us/solutions/industry/insurance/)
- [Manufacturing & Industrial](https://www.minitab.com/en-us/solutions/industry/manufacturing-industrial/)
- [Services](https://www.minitab.com/en-us/solutions/industry/service-industries/)
- [Software & Technology](https://www.minitab.com/en-us/solutions/industry/software-technology/)
- [Construction](https://www.minitab.com/en-us/solutions/industry/construction/)
- [Featured Roles](https://www.minitab.com/en-us/solutions/role/)
- [Engineering](https://www.minitab.com/en-us/solutions/role/engineering/)
- [Business Analysis](https://www.minitab.com/en-us/solutions/role/business-analysts/)
- [Information Technology](https://www.minitab.com/en-us/solutions/role/information-technology/)
- [Supply Chain](https://www.minitab.com/en-us/solutions/role/supply-chain/)
- [Customer Service & Contact Center](https://www.minitab.com/en-us/solutions/role/customer-service-contact-center/)
- [Human Resources](https://www.minitab.com/en-us/solutions/role/human-resources/)
- [Marketing](https://www.minitab.com/en-us/solutions/role/marketing/)
- [Research and Development](https://www.minitab.com/en-us/solutions/role/research-and-development/)
- Resources & Services
Back
[Resources & Services](https://www.minitab.com/en-us/resources-services/)
[All Resources & Services](https://www.minitab.com/en-us/resources-services/)
- [Resources](https://www.minitab.com/en-us/resources-services/resources/)
- [Case Studies](https://www.minitab.com/en-us/resources-services/resources/case-studies/)
- [eBooks & White Papers](https://www.minitab.com/en-us/resources-services/resources/ebooks-and-white-papers/)
- [Blog](https://blog.minitab.com/blog/?hsLang=en)
- [Data Sets](https://www.minitab.com/en-us/resources-services/resources/data-set/)
- [Webinars & Events](https://www.minitab.com/en-us/resources-services/resources/events/)
- [Education Hub](https://www.minitab.com/en-us/resources-services/resources/education-hub/)
- [Services](https://www.minitab.com/en-us/resources-services/services/)
- [Training](https://www.minitab.com/en-us/resources-services/services/training/)
- [Deployment](https://www.minitab.com/en-us/resources-services/services/deployment/)
- [Consulting](https://www.minitab.com/en-us/resources-services/services/statistical-consulting/)
- [Self-Paced Learning](https://www.minitab.com/en-us/resources-services/services/self-paced-learning/)
- [Continuing Education](https://www.minitab.com/en-us/resources-services/services/continuing-education/)
- Support
Back
[Support](https://www.minitab.com/en-us/support/)
[Technical Support](https://www.minitab.com/en-us/support/)
- [Subscriptions & Activation](https://www.minitab.com/en-us/support/subscriptions-and-activation/)
- [Minitab Quick Start](https://www.minitab.com/en-us/support/quick-start/)
- [Training](https://www.minitab.com/en-us/resources-services/services/training/)
- [Installation Support](https://www.minitab.com/en-us/support/installation/)
- [Support Videos](https://www.minitab.com/en-us/support/videos/)
- [Support Documentation](https://www.minitab.com/en-us/support/documents/)
- [Software Updates](https://www.minitab.com/en-us/support/software-updates/)
- [Product Downloads](https://www.minitab.com/en-us/support/downloads/)
- [Support Policy](https://www.minitab.com/en-us/support/policy/)
- Company
Back
[Company](https://www.minitab.com/en-us/company/)
[Company](https://www.minitab.com/en-us/company/)
- [About Us](https://www.minitab.com/en-us/company/our-company/)
- [Leadership Team](https://www.minitab.com/en-us/company/leadership-team/)
- [Partners](https://www.minitab.com/en-us/company/partners/)
- [Careers](https://www.minitab.com/en-us/company/careers/)
- [Contact](https://www.minitab.com/en-us/company/contact-us/)
- [News](https://www.minitab.com/en-us/company/press-releases/)
[Try/Buy](https://www.minitab.com/en-us/try-buy/)
- [Statistics](https://blog.minitab.com/en/blog/tag/statistics)
- [Data Analysis](https://blog.minitab.com/en/blog/tag/data-analysis)
-
- [Quality Improvement](https://blog.minitab.com/en/blog/tag/quality-improvement)
- [Subscribe](https://info.minitab.com/blog/subscribe?hsLang=en)

## Notice
You are now leaving minitab.com.
Click Continue to proceed to:
Continue
Go Back
# Leaving Out-of-control Points Out of Control Chart Calculations Looks Hard, but It Isn't
[Cody Steele](https://blog.minitab.com/en/blog/author/cody-steele) | 6/1/2017
Topics: [Quality Improvement](https://blog.minitab.com/en/blog/tag/quality-improvement), [Six Sigma](https://blog.minitab.com/en/blog/tag/six-sigma), [Lean Six Sigma](https://blog.minitab.com/en/blog/tag/lean-six-sigma), [Control Charts](https://blog.minitab.com/en/blog/tag/control-charts)
- [Share](https://www.linkedin.com/shareArticle?mini=true&url=https://blog.minitab.com/en/blog/statistics-and-quality-improvement/leaving-out-of-control-points-out-of-control-chart-calculations-looks-hard2c-but-it-isnt)
- [Share](https://www.facebook.com/sharer.php?u=https://blog.minitab.com/en/blog/statistics-and-quality-improvement/leaving-out-of-control-points-out-of-control-chart-calculations-looks-hard2c-but-it-isnt)
[Control charts](https://blog.minitab.com/blog/understanding-statistics/control-chart-tutorials-and-examples?hsLang=en) are excellent tools for looking at data points that seem unusual and for deciding whether they're worthy of investigation. If you use control charts frequently, then you're used to the idea that if certain subgroups reflect temporary abnormalities, you can leave them out when you calculate your center line and control limits. If you include points that you already know are different because of an assignable cause, you reduce the sensitivity of your control chart to other, unknown causes that you would want to investigate. Fortunately, Minitab Statistical Software makes it fast and easy to leave points out when you calculate your center line and control limits. And because Minitab’s so powerful, you have the flexibility to decide if and how the omitted points appear on your chart.
Here’s an example with some environmental data taken from [the Meyer Park ozone detector in Houston, Texas](http://www.tceq.texas.gov/cgi-bin/compliance/monops/yearly_summary.pl). The data are the readings at midnight from January 1, 2014 to November 9, 2014. (My knowledge of ozone is too limited to properly chart these data, but they’re going to make a nice illustration. Please forgive my scientific deficiencies.) If you plot these on an individuals chart with all of the data, you get this:
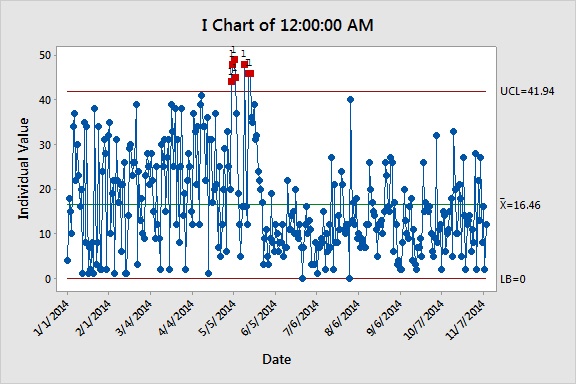
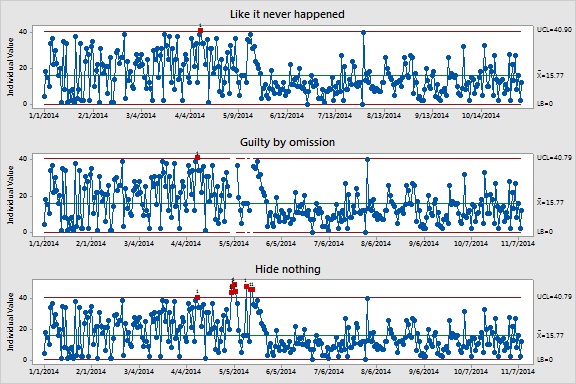
Beginning on May 3, a two-week period contains 7 out of 14 days where the ozone measurements are higher than you would expect based on the amount that they normally vary. If we know the reason that these days have higher measurements, then we could exclude them from the calculation of the center line and control limits. Here are the three options for what to do with the points:
## Like it never happened
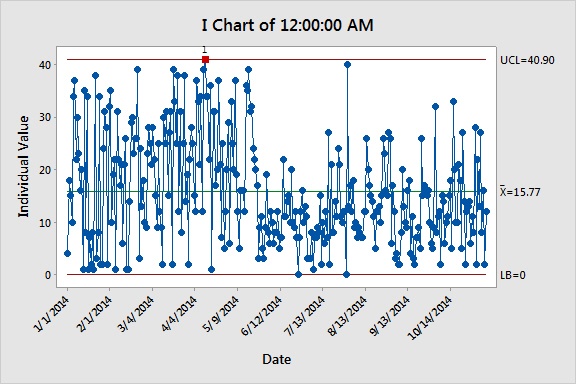
One way to handle points that you don't want to use to calculate the center line and control limits is to act like they never happened. The points neither appear on the chart, nor are there gaps that show where omitted points were. The fastest way to do this is by [brushing](http://support.minitab.com/en-us/minitab/17/topic-library/basic-statistics-and-graphs/graph-options/exploring-data-and-revising-graphs/using-brushing-to-investigate-data-points/):
1. On the Graph Editing toolbar, click the paintbrush.

1. Click and drag a square that surrounds the 7 out-of-control points.
2. Press CTRL + E to recall the Individuals chart dialog box.
3. Click **Data Options**.
4. Select **Specify which rows to exclude**.
5. Select **Brushed Rows**.
6. Click **OK** twice.
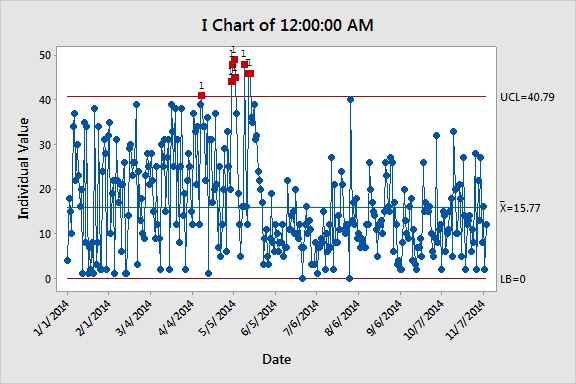
On the resulting chart, the upper control limit changes from 41.94 parts per billion to 40.79 parts per billion. The new limits indicate that April 11 was also a measurement that's larger than expected based on the variation typical of the rest of the data. These two facts will be true on the control chart no matter how you treat the omitted points. What's special about this chart is that there's no suggestion that any other data exists. The focus of the chart is on the new out-of-control point:
## Guilty by omission
A display that only shows the data used to calculate the control line and center limits might be exactly what you want, but you might also want to acknowledge that you didn't use all of the data in the data set. In this case, after step 6, you would check the box labeled **Leave gaps for excluded points**. The resulting gaps look like this:
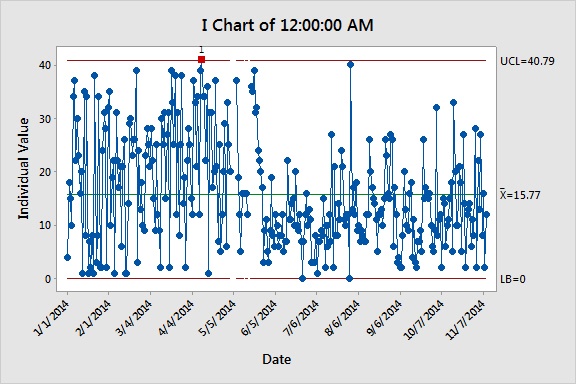
In this case, the spaces are most obvious in the control limit line, but the gaps also exist in the lines that connect the data points. The chart shows that some data was left out.
## Hide nothing
In many cases, not showing data that wasn't in the calculations for the center line and control limits is effective. However, we might want to show all of the points that were out-of-control in the original data. In this case, we would still brush the points, but not use the Data Options. Starting from the chart that calculated the center line and control limits from all of the data, these would be the steps:
1. On the Graph Editing toolbar, click the paintbrush.

1. Click and drag a square that surrounds the 7 out-of-control points.
2. Press CTRL + E to recall the Individuals chart dialog box. Arrange the dialog box so that you can see the list of brushed points.
3. Click **I Chart Options**.
4. Select the **Estimate** tab.
5. Under **Omit the following subgroups when estimating parameters**, enter the row numbers from the list of brushed points.
6. Click **OK** twice.
This chart still shows the new center line, control limits, and out-of-control point, but also includes the points that were omitted from the calculations.
## Wrap up
Control charts help you to identify when some of your data are different than the rest so that you can examine the cause more closely. Developing control limits that exclude data points with an assignable cause is easy in Minitab and you also have the flexibility to decide how to display these points to convey the most important information. The only thing better than getting the best information from your data? Getting the best information from your data faster!
##### The image of the Houston skyline is from [Wikimedia commons](http://commons.wikimedia.org/wiki/File:Houston_Skyline11.jpg) and is licensed under [this creative commons license](http://creativecommons.org/licenses/by-sa/3.0/).
## You Might Also Like
[Do You Really Need That New Machine? How Minitab Can Help You Find Out](https://blog.minitab.com/en/blog/do-you-really-need-that-new-machine-how-minitab-can-help-you-find-out?hsLang=en)
[Quality Improvement](https://blog.minitab.com/en/blog/tag/quality-improvement) | 4 Minute Read
[Go See the Work: The Power of a Gemba Walk](https://blog.minitab.com/en/blog/gemba-walk-tools?hsLang=en)
[Lean Six Sigma](https://blog.minitab.com/en/blog/tag/lean-six-sigma) | 2 Minute Read
[Streamlining Government Processes with Six Sigma Solutions – Part 2](https://blog.minitab.com/en/blog/government-agencies-use-six-sigma-part-2?hsLang=en)
[Lean Six Sigma](https://blog.minitab.com/en/blog/tag/lean-six-sigma) | 4 Minute Read
---
- [Careers](https://www.minitab.com/en-us/company/careers/)
- [Trust Center](https://www.minitab.com/en-us/trust-center/)
- [Suppliers](https://www.minitab.com/en-us/suppliers/)
- [Site Map](https://www.minitab.com/en-us/site-map/)
- [](https://www.linkedin.com/company/minitab/)
- [](https://www.facebook.com/Minitab/)
- [](https://www.youtube.com/user/MinitabInc)
- [](https://www.instagram.com/minitab/)
---
© 2025 Minitab, LLC. All Rights Reserved.
- [Terms of Use](https://www.minitab.com/en-us/legal/terms-of-use/)
- [Privacy Policy](https://www.minitab.com/en-us/legal/privacy-policy/)
- [Legal](https://www.minitab.com/en-us/legal/)
- Cookies Settings