---
title: Using Regression to Evaluate Project Results, part 1
description: Using Regression to Evaluate Project Results, part 1
image: https://blog.minitab.com/hubfs/B2BML%20-%20NEW%20FILE%20MANAGER%20STRUCTURE/Blog%20Images/Imported_Blog_Media/recyclables-3.png
---
English
- [English](https://blog.minitab.com/en/?hsLang=en)
- [Français](https://blog.minitab.com/fr/?hsLang=en)
- [Deutsch](https://blog.minitab.com/de/?hsLang=en)
- [Português](https://blog.minitab.com/pt/?hsLang=en)
- [Español](https://blog.minitab.com/es/?hsLang=en)
- [日本語](https://blog.minitab.com/ja/?hsLang=en)
- [한국어](https://blog.minitab.com/ko/?hsLang=en)
- [中文(简体)](https://blog.minitab.com/zh/?hsLang=en)
- [ Partners](https://www.minitab.com/en-us/company/partners/)
- [ Contact](https://www.minitab.com/en-us/company/contact-us/)
- [ Talk to Minitab](https://www.minitab.com/en-us/talk-to-minitab/)
- [ My Account](https://licensing.minitab.com/account/manage)
[](https://www.minitab.com/en-us/)
- Products
Back
[Products](https://www.minitab.com/en-us/products/)
[All Products](https://www.minitab.com/en-us/products/)
- [Minitab Solution Center](https://www.minitab.com/en-us/products/minitab-solution-center/)
- [Minitab Statistical Software](https://www.minitab.com/en-us/products/minitab/)
- [Minitab Connect](https://www.minitab.com/en-us/products/connect/)
- [Minitab Model Ops](https://www.minitab.com/en-us/products/model-ops/)
- [Minitab Education Hub](https://www.minitab.com/en-us/products/education-hub/)
- [Minitab Engage](https://www.minitab.com/en-us/products/engage/)
- [Minitab Workspace](https://www.minitab.com/en-us/products/workspace/)
- [Real-Time SPC](https://www.minitab.com/en-us/products/real-time-spc/)
- [Prolink Data Collection & SPC](https://www.minitab.com/en-us/products/prolink)
- [Simul8 Discrete Event Simulation](https://info.minitab.com/en/new-to-simul8?hsLang=en)
- [SPM](https://www.minitab.com/en-us/products/spm/)
- Solutions
Back
[Solutions](https://www.minitab.com/en-us/solutions/)
[All Solutions](https://www.minitab.com/en-us/solutions/)
- [Analytics](https://www.minitab.com/en-us/solutions/analytics/)
- [Statistics & Predictive Analytics](https://www.minitab.com/en-us/solutions/analytics/statistical-analysis-predictive-analytics/)
- [Data Science & Machine Learning](https://www.minitab.com/en-us/solutions/analytics/data-science-machine-learning/)
- [Business Analytics & Intelligence](https://www.minitab.com/en-us/solutions/analytics/business-analytics-intelligence/)
- [Statistical Process Control](https://www.minitab.com/en-us/solutions/analytics/statistical-process-control/)
- [Quality Analytics](https://www.minitab.com/en-us/solutions/analytics/quality-analytics/)
- [Live Analytics](https://www.minitab.com/en-us/solutions/analytics/live-analytics/)
- [Reliability & Life Data Analysis](https://www.minitab.com/en-us/solutions/analytics/reliability/)
- [Discrete Event Simulation](https://info.minitab.com/en/new-to-simul8?hsLang=en)
- [Process Mining](https://info.minitab.com/en/new-to-simul8?hsLang=en)
- [Key Capabilities](https://www.minitab.com/en-us/solutions/key-capabilities/)
- [Continuous Improvement](https://www.minitab.com/en-us/solutions/key-capabilities/continuous-improvement/)
- [Data Integration & Data Prep](https://www.minitab.com/en-us/solutions/key-capabilities/data-integration-data-prep/)
- [Diagramming & Mind Mapping](https://www.minitab.com/en-us/solutions/key-capabilities/diagramming-mind-mapping/)
- [Digital Twins](https://info.minitab.com/en/new-to-simul8?hsLang=en)
- [Model Deployment & ML Ops](https://www.minitab.com/en-us/solutions/key-capabilities/model-deployment-ml-ops/)
- [Innovation & Project Management](https://www.minitab.com/en-us/solutions/key-capabilities/innovation-project-management/)
- [Process Excellence: Detect, Correct & Prevent](https://www.minitab.com/en-us/solutions/key-capabilities/process-excellence/)
- [Featured Industries](https://www.minitab.com/en-us/solutions/industry/)
- [Academic](https://www.minitab.com/en-us/solutions/industry/academic/)
- [Energy & Natural Resources](https://www.minitab.com/en-us/solutions/industry/energy-resources/)
- [Government & Public Sector](https://www.minitab.com/en-us/solutions/industry/government/)
- [Healthcare](https://www.minitab.com/en-us/solutions/industry/healthcare/)
- [Insurance](https://www.minitab.com/en-us/solutions/industry/insurance/)
- [Manufacturing & Industrial](https://www.minitab.com/en-us/solutions/industry/manufacturing-industrial/)
- [Services](https://www.minitab.com/en-us/solutions/industry/service-industries/)
- [Software & Technology](https://www.minitab.com/en-us/solutions/industry/software-technology/)
- [Construction](https://www.minitab.com/en-us/solutions/industry/construction/)
- [Featured Roles](https://www.minitab.com/en-us/solutions/role/)
- [Engineering](https://www.minitab.com/en-us/solutions/role/engineering/)
- [Business Analysis](https://www.minitab.com/en-us/solutions/role/business-analysts/)
- [Information Technology](https://www.minitab.com/en-us/solutions/role/information-technology/)
- [Supply Chain](https://www.minitab.com/en-us/solutions/role/supply-chain/)
- [Customer Service & Contact Center](https://www.minitab.com/en-us/solutions/role/customer-service-contact-center/)
- [Human Resources](https://www.minitab.com/en-us/solutions/role/human-resources/)
- [Marketing](https://www.minitab.com/en-us/solutions/role/marketing/)
- [Research and Development](https://www.minitab.com/en-us/solutions/role/research-and-development/)
- Resources & Services
Back
[Resources & Services](https://www.minitab.com/en-us/resources-services/)
[All Resources & Services](https://www.minitab.com/en-us/resources-services/)
- [Resources](https://www.minitab.com/en-us/resources-services/resources/)
- [Case Studies](https://www.minitab.com/en-us/resources-services/resources/case-studies/)
- [eBooks & White Papers](https://www.minitab.com/en-us/resources-services/resources/ebooks-and-white-papers/)
- [Blog](https://blog.minitab.com/blog/?hsLang=en)
- [Data Sets](https://www.minitab.com/en-us/resources-services/resources/data-set/)
- [Webinars & Events](https://www.minitab.com/en-us/resources-services/resources/events/)
- [Education Hub](https://www.minitab.com/en-us/resources-services/resources/education-hub/)
- [Services](https://www.minitab.com/en-us/resources-services/services/)
- [Training](https://www.minitab.com/en-us/resources-services/services/training/)
- [Deployment](https://www.minitab.com/en-us/resources-services/services/deployment/)
- [Consulting](https://www.minitab.com/en-us/resources-services/services/statistical-consulting/)
- [Self-Paced Learning](https://www.minitab.com/en-us/resources-services/services/self-paced-learning/)
- [Continuing Education](https://www.minitab.com/en-us/resources-services/services/continuing-education/)
- Support
Back
[Support](https://www.minitab.com/en-us/support/)
[Technical Support](https://www.minitab.com/en-us/support/)
- [Subscriptions & Activation](https://www.minitab.com/en-us/support/subscriptions-and-activation/)
- [Minitab Quick Start](https://www.minitab.com/en-us/support/quick-start/)
- [Training](https://www.minitab.com/en-us/resources-services/services/training/)
- [Installation Support](https://www.minitab.com/en-us/support/installation/)
- [Support Videos](https://www.minitab.com/en-us/support/videos/)
- [Support Documentation](https://www.minitab.com/en-us/support/documents/)
- [Software Updates](https://www.minitab.com/en-us/support/software-updates/)
- [Product Downloads](https://www.minitab.com/en-us/support/downloads/)
- [Support Policy](https://www.minitab.com/en-us/support/policy/)
- Company
Back
[Company](https://www.minitab.com/en-us/company/)
[Company](https://www.minitab.com/en-us/company/)
- [About Us](https://www.minitab.com/en-us/company/our-company/)
- [Leadership Team](https://www.minitab.com/en-us/company/leadership-team/)
- [Partners](https://www.minitab.com/en-us/company/partners/)
- [Careers](https://www.minitab.com/en-us/company/careers/)
- [Contact](https://www.minitab.com/en-us/company/contact-us/)
- [News](https://www.minitab.com/en-us/company/press-releases/)
[Try/Buy](https://www.minitab.com/en-us/try-buy/)
- [Statistics](https://blog.minitab.com/en/blog/tag/statistics)
- [Data Analysis](https://blog.minitab.com/en/blog/tag/data-analysis)
-
- [Quality Improvement](https://blog.minitab.com/en/blog/tag/quality-improvement)
- [Subscribe](https://info.minitab.com/blog/subscribe?hsLang=en)

## Notice
You are now leaving minitab.com.
Click Continue to proceed to:
Continue
Go Back
# Using Regression to Evaluate Project Results, part 1
Minitab Guest Blogger | 2/16/2015
Topics: [Regression Analysis](https://blog.minitab.com/en/blog/tag/regression-analysis)
- [Share](https://www.linkedin.com/shareArticle?mini=true&url=https://blog.minitab.com/en/blog/statistics-in-the-field/using-regression-to-evaluate-project-results-part-1)
- [Share](https://www.facebook.com/sharer.php?u=https://blog.minitab.com/en/blog/statistics-in-the-field/using-regression-to-evaluate-project-results-part-1)
*By Peter Olejnik, guest blogger.*
Previous posts on the Minitab Blog have discussed the work of the Six Sigma students at [Rose-Hulman Institute of Technology](http://rose-hulman.edu/) to reduce the quantities of recyclables that wind up in the trash. Led by Dr. Diane Evans, these students continue to make an important impact on their community.
As with any Six Sigma process, the results of the work need to be evaluated. A simple two-sample T test could be performed, but it gives us a very limited amount of information – only whether there is a difference between the before and after improvement data. But what if we want to know if a certain item or factor affects the amount of recyclables disposed of? What if we wanted to know by how much of an effect important factors have? What if we want to create a predictive model that can estimate the weight of the recyclables without the use of a scale?
Sounds like a lot of work, right? But actually, with the use of regression analysis tools in Minitab Statistical Software, it's quite easy!
In this two-part blog post, I’ll share with you how my team used regression analysis to identify and model the factors that are important in making sure recyclables are handled appropriately.
## Preparing Your Data for Regression Analysis
All the teams involved in this project collected a substantial amount of data. But some of this data is somewhat subjective. Also, this data has been recorded in a manner that is geared toward people, and not necessarily for analysis by computers. To start doing analysis in Minitab, all of our data points need to be quantifiable and in long format.
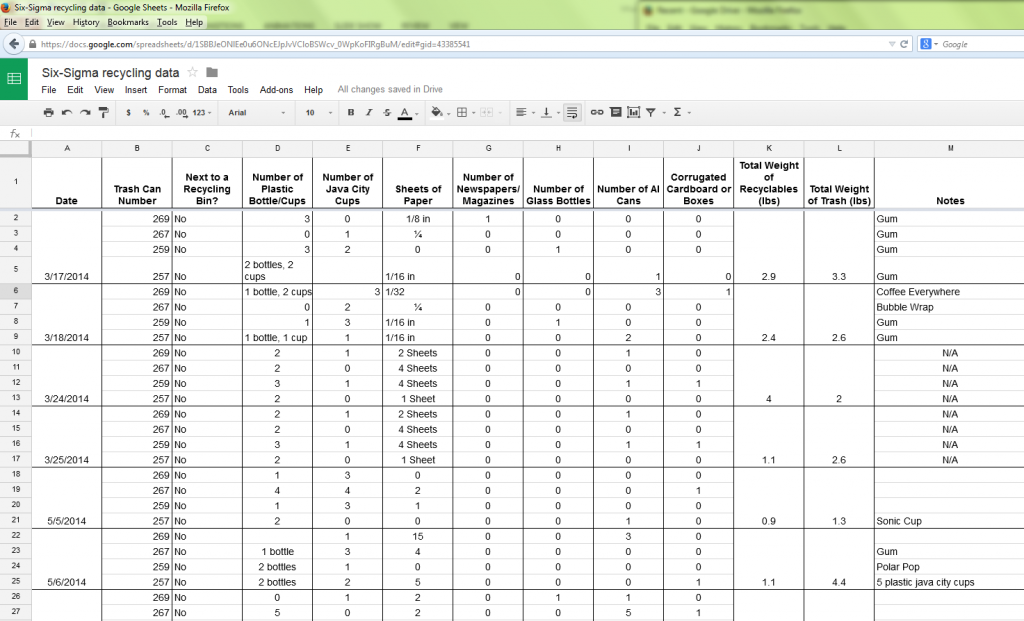
*The Data as Inserted by the Six Sigma Teams*
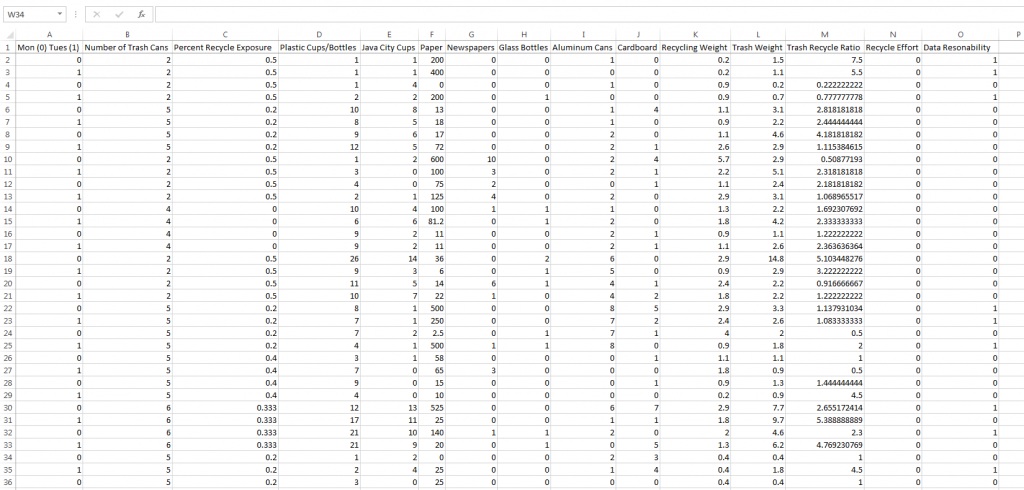
*The Data, After Conversion into Long Format and Quantifiable Values*
Now that we have all this data in a computer-friendly format, we need to identify and eliminate any extreme outliers present, since they can distort our final model. First we create a regression model with all of the factors included. As part of this, we generate the residuals from the data vs. the fit. For our analysis, we utilized deleted T-residuals. These are less affected by the skew of an outlier compared to regular T-residuals, making it them better indicator. These can be selected to be displayed by Minitab in the same manner that any other residual can be selected. Looking at these residuals, those with values above 4 were removed. A new fit was then created and the process was repeated until no outliers remain.
## Satisfying the Assumptions for Regression Analysis
Once the outliers have been eliminated, we need to verify the regression assumptions for our data to ensure that the analysis conducted is valid. We need to satisfy five assumptions:
1. The mean value of the errors is zero.
2. The variance of the errors is even and consistent (or “homoscedastic”) through the data.
3. The data is independent and identically distributed (IID).
4. The errors are normally distributed.
5. There is negligible variance in the predictor values.
For our third assumption, we know that the data points should be IID, because each area’s daily trash collection should have no effect on that of other areas or the next day’s collection. We have no reason to suspect otherwise. The fifth assumption is also believed to have been met, as we have no reason to suspect that there is variance in the predictor value. This means that only three of the five assumptions still need to be checked.
Our first and second assumptions can be checked simply by plotting the deleted T-residuals against the individual factors, as well as the fits and visually inspecting them.
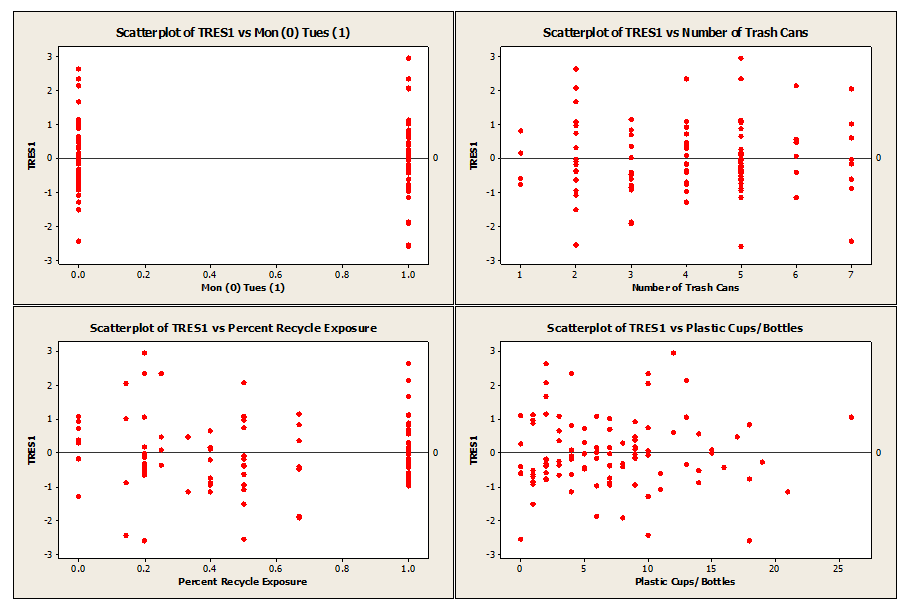
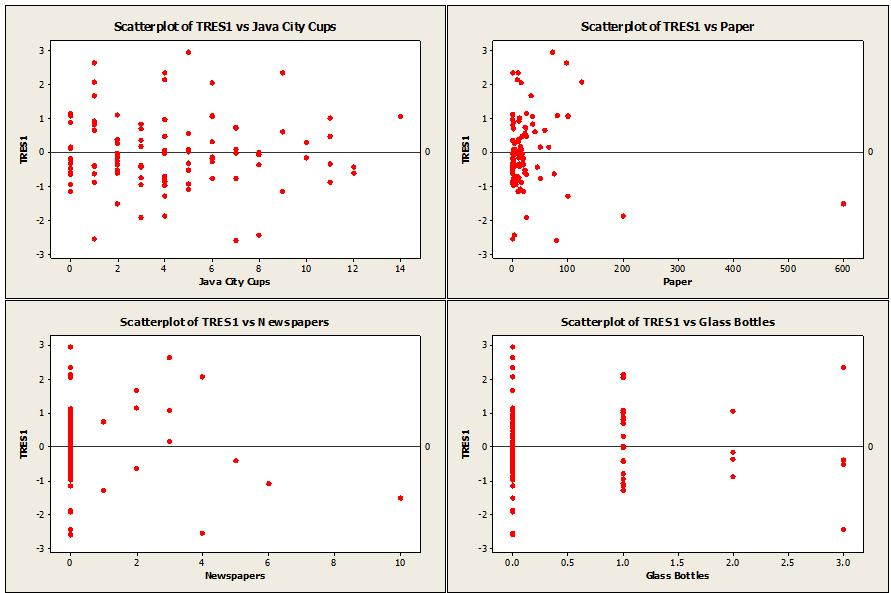
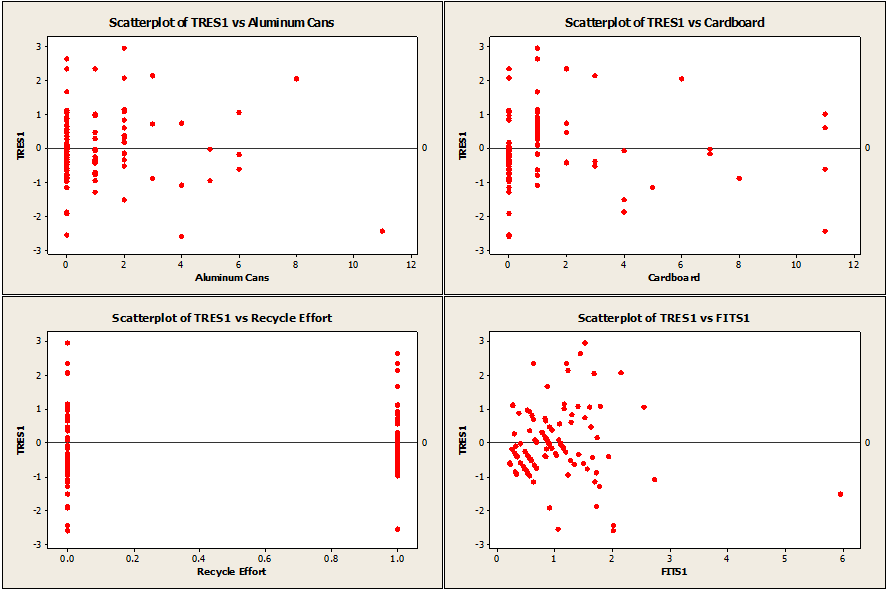
*   Plots used to verify regression assumptions.*
When looking over the scatter plots, it looks like these two assumptions are met. Checking the fourth assumption is just as easy. All that needs to be done is to run a normality test on the deleted T-residuals.
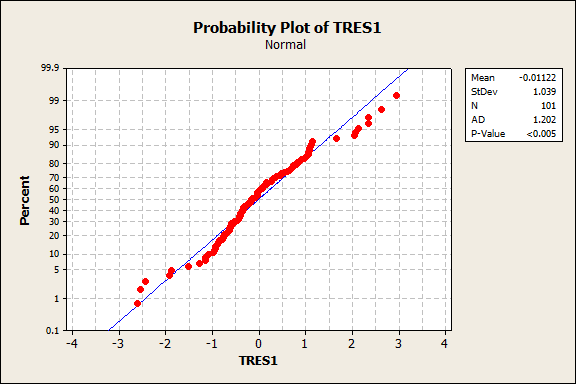
*Normality plot of deleted T-residuals*
It appears that our residuals are not normally distributed, as seen by the p-value of our test. This is problematic, as it means any analysis we would conduct would be invalid. Fortunately, all is not lost: we can perform a Box-Cox analysis on our results. This will tell us is if the response variable needs to be raised by a power.
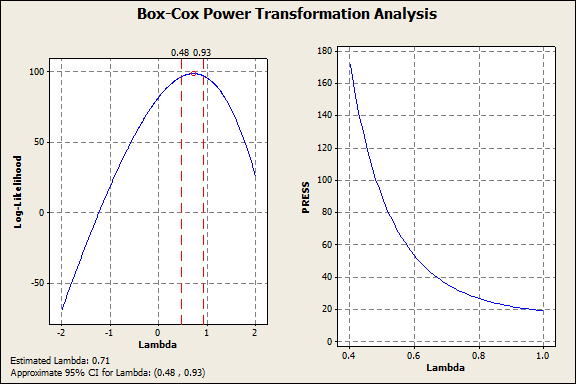
*Box-Cox analysis of the data*
The results of this analysis indicate that the response variable should be raised by a constant of 0.75. A new model and residuals can be generated from this modified response variable and the assumptions can be checked.
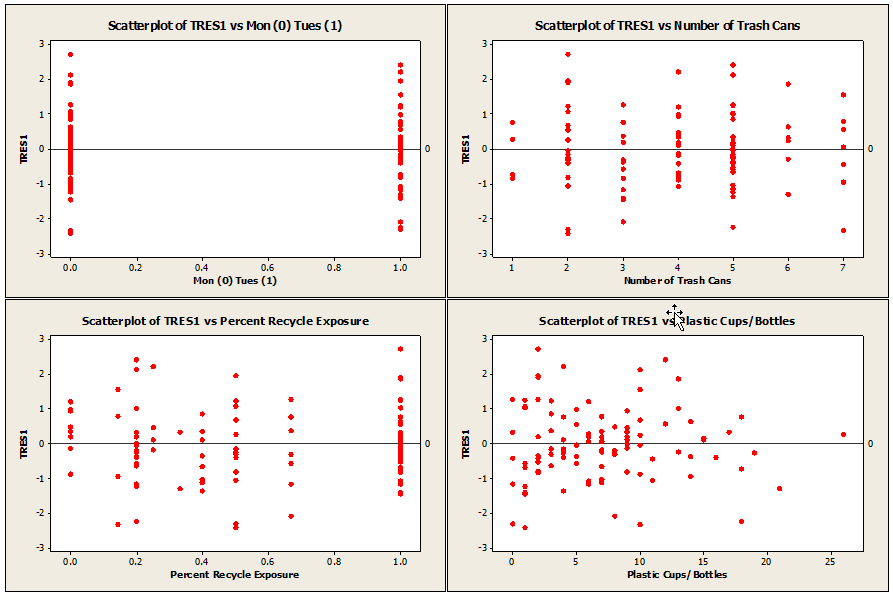
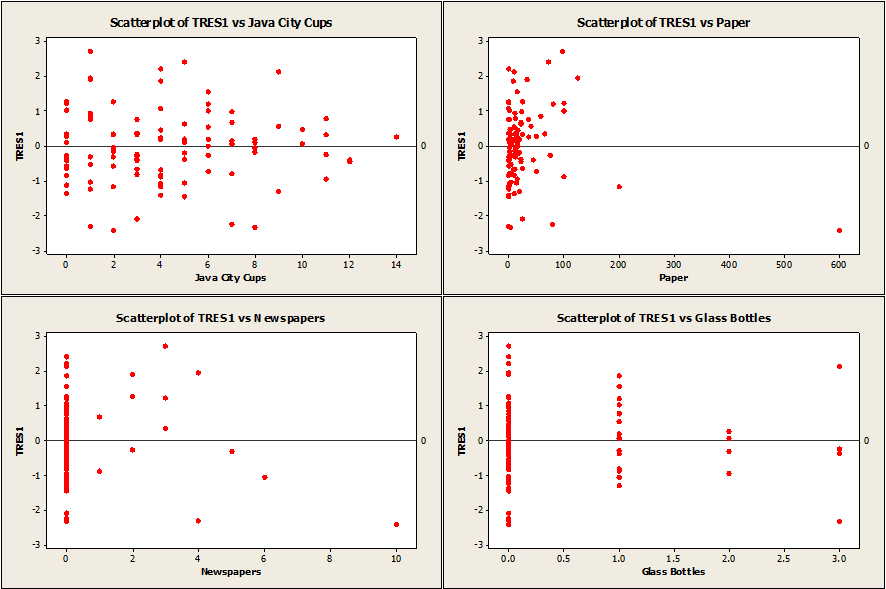
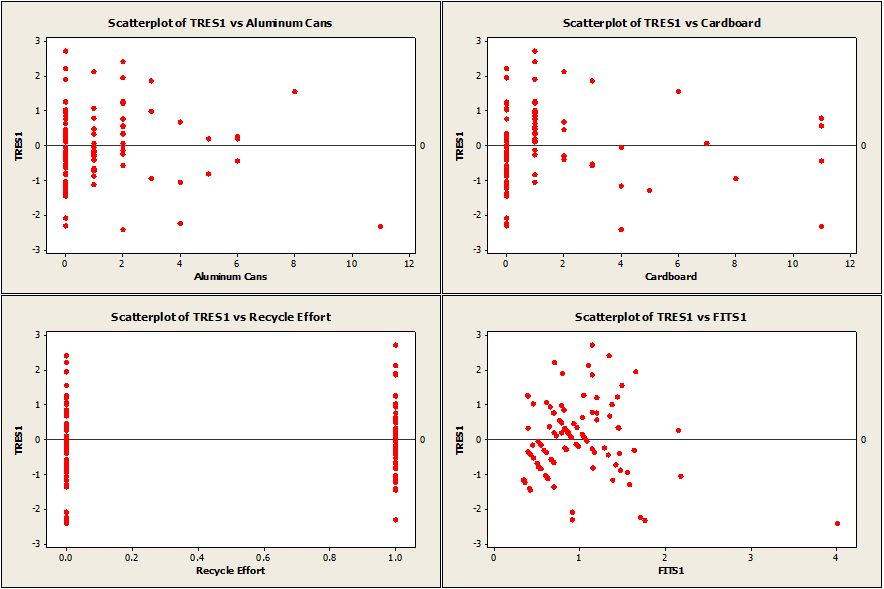*New plots used in order to verify regression assumptions for revised model.*
The residuals again appear to be homoscedastic and centered about zero.
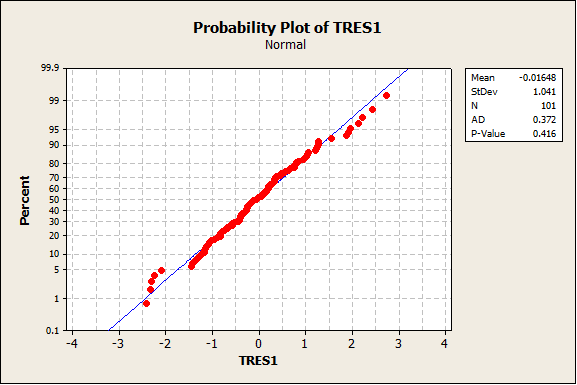
*Normality plot on deleted T-residuals*
The residuals now are normally distributed. Our data is now prepped and ready for analysis!
The second part of this post will detail the regression analysis.
**About the Guest Blogger**
*Peter Olejnik is a graduate student at the Rose-Hulman Institute of Technology in Terre Haute, Indiana. He holds a bachelor’s degree in mechanical engineering and his professional interests include controls engineering and data analysis.*
## You Might Also Like
[How One Hotel Used Data to Improve Guest Satisfaction](https://blog.minitab.com/en/blog/how-one-hotel-used-data-to-improve-guest-satisfaction?hsLang=en)
[Brainstorm](https://blog.minitab.com/en/blog/tag/brainstorm) | 9 Minute Read
[Enhancing Accelerated Underwriting Efficiency with Predictive Analytics](https://blog.minitab.com/en/blog/enhancing-accelerated-underwriting-efficiency-with-predictive-analytics?hsLang=en)
[Regression Analysis](https://blog.minitab.com/en/blog/tag/regression-analysis) | 3 Minute Read
[Predictive Analytics and Determining Patient Length of Stay at Time of Admission](https://blog.minitab.com/en/blog/predictive-analytics-and-determining-patient-length-of-stay-at-time-of-admission?hsLang=en)
[Regression Analysis](https://blog.minitab.com/en/blog/tag/regression-analysis) | 5 Minute Read
---
- [Careers](https://www.minitab.com/en-us/company/careers/)
- [Trust Center](https://www.minitab.com/en-us/trust-center/)
- [Suppliers](https://www.minitab.com/en-us/suppliers/)
- [Site Map](https://www.minitab.com/en-us/site-map/)
- [](https://www.linkedin.com/company/minitab/)
- [](https://www.facebook.com/Minitab/)
- [](https://www.youtube.com/user/MinitabInc)
- [](https://www.instagram.com/minitab/)
---
© 2025 Minitab, LLC. All Rights Reserved.
- [Terms of Use](https://www.minitab.com/en-us/legal/terms-of-use/)
- [Privacy Policy](https://www.minitab.com/en-us/legal/privacy-policy/)
- [Legal](https://www.minitab.com/en-us/legal/)
- Cookies Settings