---
title: Controls Charts Are Good for So Much More than SPC!
description: Controls Charts Are Good for So Much More than SPC!
image: https://blog.minitab.com/hubfs/B2BML%20-%20NEW%20FILE%20MANAGER%20STRUCTURE/Blog%20Images/Imported_Blog_Media/xbars_grf_w1024.jpg
---
English
- [English](https://blog.minitab.com/en/?hsLang=en)
- [Français](https://blog.minitab.com/fr/?hsLang=en)
- [Deutsch](https://blog.minitab.com/de/?hsLang=en)
- [Português](https://blog.minitab.com/pt/?hsLang=en)
- [Español](https://blog.minitab.com/es/?hsLang=en)
- [日本語](https://blog.minitab.com/ja/?hsLang=en)
- [한국어](https://blog.minitab.com/ko/?hsLang=en)
- [中文(简体)](https://blog.minitab.com/zh/?hsLang=en)
- [English](https://blog.minitab.com/en/blog/understanding-statistics/controls-charts-are-good-for-so-much-more-than-spc)
- [Deutsch](https://blog.minitab.com/de/blog/darum-muessen-regelkarten-beherrscht-sein)
- [Français](https://blog.minitab.com/fr/blog/cinq-facons-de-rendre-vos-cartes-de-controle-plus-efficaces)
- [ Partners](https://www.minitab.com/en-us/company/partners/)
- [ Contact](https://www.minitab.com/en-us/company/contact-us/)
- [ Talk to Minitab](https://www.minitab.com/en-us/talk-to-minitab/)
- [ My Account](https://licensing.minitab.com/account/manage)
[](https://www.minitab.com/en-us/)
- Products
Back
[Products](https://www.minitab.com/en-us/products/)
[All Products](https://www.minitab.com/en-us/products/)
- [Minitab Solution Center](https://www.minitab.com/en-us/products/minitab-solution-center/)
- [Minitab Statistical Software](https://www.minitab.com/en-us/products/minitab/)
- [Minitab Connect](https://www.minitab.com/en-us/products/connect/)
- [Minitab Model Ops](https://www.minitab.com/en-us/products/model-ops/)
- [Minitab Education Hub](https://www.minitab.com/en-us/products/education-hub/)
- [Minitab Engage](https://www.minitab.com/en-us/products/engage/)
- [Minitab Workspace](https://www.minitab.com/en-us/products/workspace/)
- [Real-Time SPC](https://www.minitab.com/en-us/products/real-time-spc/)
- [Prolink Data Collection & SPC](https://www.minitab.com/en-us/products/prolink)
- [Simul8 Discrete Event Simulation](https://info.minitab.com/en/new-to-simul8?hsLang=en)
- [SPM](https://www.minitab.com/en-us/products/spm/)
- Solutions
Back
[Solutions](https://www.minitab.com/en-us/solutions/)
[All Solutions](https://www.minitab.com/en-us/solutions/)
- [Analytics](https://www.minitab.com/en-us/solutions/analytics/)
- [Statistics & Predictive Analytics](https://www.minitab.com/en-us/solutions/analytics/statistical-analysis-predictive-analytics/)
- [Data Science & Machine Learning](https://www.minitab.com/en-us/solutions/analytics/data-science-machine-learning/)
- [Business Analytics & Intelligence](https://www.minitab.com/en-us/solutions/analytics/business-analytics-intelligence/)
- [Statistical Process Control](https://www.minitab.com/en-us/solutions/analytics/statistical-process-control/)
- [Quality Analytics](https://www.minitab.com/en-us/solutions/analytics/quality-analytics/)
- [Live Analytics](https://www.minitab.com/en-us/solutions/analytics/live-analytics/)
- [Reliability & Life Data Analysis](https://www.minitab.com/en-us/solutions/analytics/reliability/)
- [Discrete Event Simulation](https://info.minitab.com/en/new-to-simul8?hsLang=en)
- [Process Mining](https://info.minitab.com/en/new-to-simul8?hsLang=en)
- [Key Capabilities](https://www.minitab.com/en-us/solutions/key-capabilities/)
- [Continuous Improvement](https://www.minitab.com/en-us/solutions/key-capabilities/continuous-improvement/)
- [Data Integration & Data Prep](https://www.minitab.com/en-us/solutions/key-capabilities/data-integration-data-prep/)
- [Diagramming & Mind Mapping](https://www.minitab.com/en-us/solutions/key-capabilities/diagramming-mind-mapping/)
- [Digital Twins](https://info.minitab.com/en/new-to-simul8?hsLang=en)
- [Model Deployment & ML Ops](https://www.minitab.com/en-us/solutions/key-capabilities/model-deployment-ml-ops/)
- [Innovation & Project Management](https://www.minitab.com/en-us/solutions/key-capabilities/innovation-project-management/)
- [Process Excellence: Detect, Correct & Prevent](https://www.minitab.com/en-us/solutions/key-capabilities/process-excellence/)
- [Featured Industries](https://www.minitab.com/en-us/solutions/industry/)
- [Academic](https://www.minitab.com/en-us/solutions/industry/academic/)
- [Energy & Natural Resources](https://www.minitab.com/en-us/solutions/industry/energy-resources/)
- [Government & Public Sector](https://www.minitab.com/en-us/solutions/industry/government/)
- [Healthcare](https://www.minitab.com/en-us/solutions/industry/healthcare/)
- [Insurance](https://www.minitab.com/en-us/solutions/industry/insurance/)
- [Manufacturing & Industrial](https://www.minitab.com/en-us/solutions/industry/manufacturing-industrial/)
- [Services](https://www.minitab.com/en-us/solutions/industry/service-industries/)
- [Software & Technology](https://www.minitab.com/en-us/solutions/industry/software-technology/)
- [Construction](https://www.minitab.com/en-us/solutions/industry/construction/)
- [Featured Roles](https://www.minitab.com/en-us/solutions/role/)
- [Engineering](https://www.minitab.com/en-us/solutions/role/engineering/)
- [Business Analysis](https://www.minitab.com/en-us/solutions/role/business-analysts/)
- [Information Technology](https://www.minitab.com/en-us/solutions/role/information-technology/)
- [Supply Chain](https://www.minitab.com/en-us/solutions/role/supply-chain/)
- [Customer Service & Contact Center](https://www.minitab.com/en-us/solutions/role/customer-service-contact-center/)
- [Human Resources](https://www.minitab.com/en-us/solutions/role/human-resources/)
- [Marketing](https://www.minitab.com/en-us/solutions/role/marketing/)
- [Research and Development](https://www.minitab.com/en-us/solutions/role/research-and-development/)
- Resources & Services
Back
[Resources & Services](https://www.minitab.com/en-us/resources-services/)
[All Resources & Services](https://www.minitab.com/en-us/resources-services/)
- [Resources](https://www.minitab.com/en-us/resources-services/resources/)
- [Case Studies](https://www.minitab.com/en-us/resources-services/resources/case-studies/)
- [eBooks & White Papers](https://www.minitab.com/en-us/resources-services/resources/ebooks-and-white-papers/)
- [Blog](https://blog.minitab.com/blog/?hsLang=en)
- [Data Sets](https://www.minitab.com/en-us/resources-services/resources/data-set/)
- [Webinars & Events](https://www.minitab.com/en-us/resources-services/resources/events/)
- [Education Hub](https://www.minitab.com/en-us/resources-services/resources/education-hub/)
- [Services](https://www.minitab.com/en-us/resources-services/services/)
- [Training](https://www.minitab.com/en-us/resources-services/services/training/)
- [Deployment](https://www.minitab.com/en-us/resources-services/services/deployment/)
- [Consulting](https://www.minitab.com/en-us/resources-services/services/statistical-consulting/)
- [Self-Paced Learning](https://www.minitab.com/en-us/resources-services/services/self-paced-learning/)
- [Continuing Education](https://www.minitab.com/en-us/resources-services/services/continuing-education/)
- Support
Back
[Support](https://www.minitab.com/en-us/support/)
[Technical Support](https://www.minitab.com/en-us/support/)
- [Subscriptions & Activation](https://www.minitab.com/en-us/support/subscriptions-and-activation/)
- [Minitab Quick Start](https://www.minitab.com/en-us/support/quick-start/)
- [Training](https://www.minitab.com/en-us/resources-services/services/training/)
- [Installation Support](https://www.minitab.com/en-us/support/installation/)
- [Support Videos](https://www.minitab.com/en-us/support/videos/)
- [Support Documentation](https://www.minitab.com/en-us/support/documents/)
- [Software Updates](https://www.minitab.com/en-us/support/software-updates/)
- [Product Downloads](https://www.minitab.com/en-us/support/downloads/)
- [Support Policy](https://www.minitab.com/en-us/support/policy/)
- Company
Back
[Company](https://www.minitab.com/en-us/company/)
[Company](https://www.minitab.com/en-us/company/)
- [About Us](https://www.minitab.com/en-us/company/our-company/)
- [Leadership Team](https://www.minitab.com/en-us/company/leadership-team/)
- [Partners](https://www.minitab.com/en-us/company/partners/)
- [Careers](https://www.minitab.com/en-us/company/careers/)
- [Contact](https://www.minitab.com/en-us/company/contact-us/)
- [News](https://www.minitab.com/en-us/company/press-releases/)
[Try/Buy](https://www.minitab.com/en-us/try-buy/)
- [Statistics](https://blog.minitab.com/en/blog/tag/statistics)
- [Data Analysis](https://blog.minitab.com/en/blog/tag/data-analysis)
-
- [Quality Improvement](https://blog.minitab.com/en/blog/tag/quality-improvement)
- [Subscribe](https://info.minitab.com/blog/subscribe?hsLang=en)

## Notice
You are now leaving minitab.com.
Click Continue to proceed to:
Continue
Go Back
# Controls Charts Are Good for So Much More than SPC!
Minitab Blog Editor | 8/24/2017
Topics: [Control Charts](https://blog.minitab.com/en/blog/tag/control-charts)
- [Share](https://www.linkedin.com/shareArticle?mini=true&url=https://blog.minitab.com/en/blog/understanding-statistics/controls-charts-are-good-for-so-much-more-than-spc)
- [Share](https://www.facebook.com/sharer.php?u=https://blog.minitab.com/en/blog/understanding-statistics/controls-charts-are-good-for-so-much-more-than-spc)
Control charts take data about your process and plot it so you can distinguish between common-cause and special-cause variation. Knowing the difference is important because it permits you to address potential problems without over-controlling your process.
Control charts are fantastic for assessing the stability of a process. Is the process mean unstable, too low, or too high? Is observed variability a natural part of the process, or could it be caused by specific sources? By answering these questions, control charts let you dedicate your actions to where you can make the most impact.
Assessing whether your process is stable is valuable in itself, but it is also a necessary first step in [capability analysis](https://blog.minitab.com/blog/understanding-statistics/i-think-i-can-i-know-i-can-a-high-level-overview-of-process-capability-analysis?hsLang=en). Your process has to be stable before you can measure its capability. You can predict the performance of a stable process and therefore improve its capability. If your process is unstable, by definition it is unpredictable.
Control charts are commonly applied to business processes, but they have great benefits beyond Six Sigma and statistical process control (SPC). In fact, control charts can reveal information that would otherwise be very difficult to uncover.
## Other Processes That Need to Be In Control
Let's consider processes beyond those we encounter in business. Instability and excessive variation can cause problems in many other kinds of processes.
- A test process that causes subjects to experience an impact of 6 times their body weight.
- A teacher's process to help students learn. the material as measured by test scores.
- [A diabetic's process for maintaining blood sugar levels](https://blog.minitab.com/blog/real-world-quality-improvement/control-charts-keep-blood-sugar-in-check?hsLang=en).
The first example stems from a colleague's [research.](https://blog.minitab.com/blog/adventures-in-statistics/quality-improvement-controlling-variability-more-difficult-than-the-mean?hsLang=en) The researchers had middle-school students jump 30 times from 24-inch steps every other school day to see if it increased their bone density. Treatment was defined as the subjects experiencing an impact of 6 body weights, but the research team didn't quite hit the mark.
My colleague conducted a pilot study and graphed the results in an Xbar-S chart.
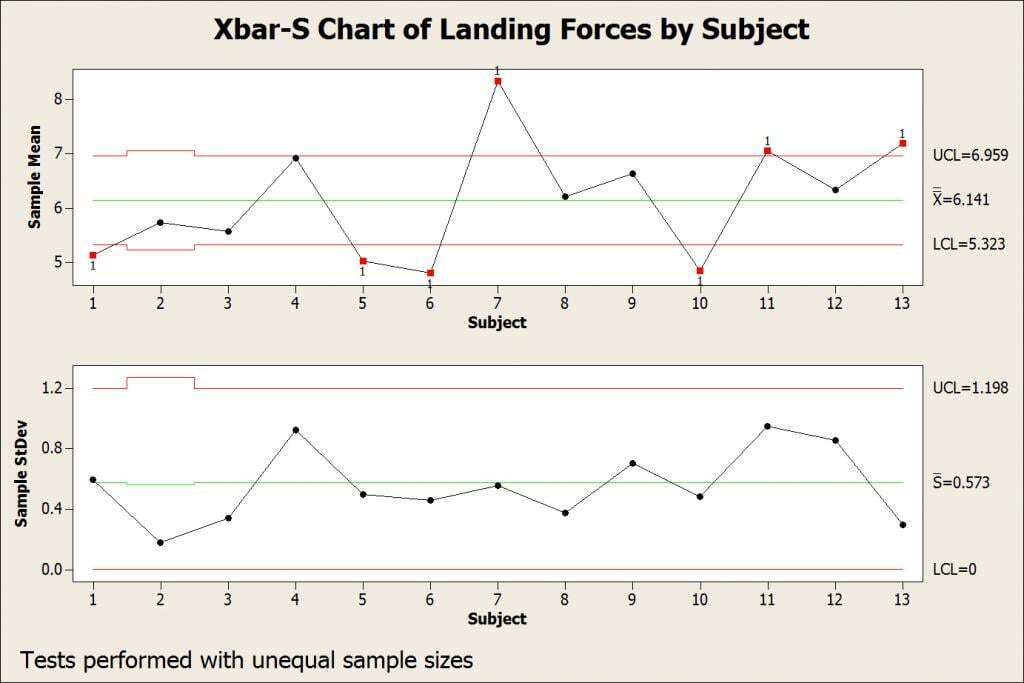
The fact that the S chart (on the bottom) is in control means each subject has a consistent landing style with impacts of a consistent magnitude—the variability is in control.
But the Xbar chart (at the top) is clearly out of control, indicating that even though the overall mean (6.141) exceeds the target, individual subjects have very different means. Some are consistently hard landers while others are consistently soft landers. The control chart suggests that the variability is not natural process variation (common cause) but rather due to differences among the participants (special cause variation).
The researchers addressed this by training the subjects how to land. They also had a nurse observe all future jumping sessions. These actions reduced the variability to the point that impacts were consistently greater than 6 body weights.
## Control Charts as a Prerequisite for Statistical Hypothesis Tests
Control charts can verify that a process is stable, as required for capability analysis. But control charts can be used similarly to test assumptions for [hypothesis tests](https://blog.minitab.com/blog/adventures-in-statistics/understanding-hypothesis-tests%3A-why-we-need-to-use-hypothesis-tests-in-statistics?hsLang=en).
Specifically, the measurements used in a hypothesis test are assumed to be stable, though this assumption is often overlooked. This assumption parallels the requirement for stability in capability analysis: if your measurements are not stable, inferences based on those measurements will not be reliable.
Let’s assume that we’re comparing test scores between group A and group B. We’ll use this [data set](https://cdn.app.compendium.com/uploads/user/458939f4-fe08-4dbc-b271-efca0f5a2682/742d7708-efd3-492c-abff-6044d78e3bbd/File/6053477fc294de59d5b3837389daab3a/groupcomparison.MTW) to perform a 2-sample t-test as shown below.
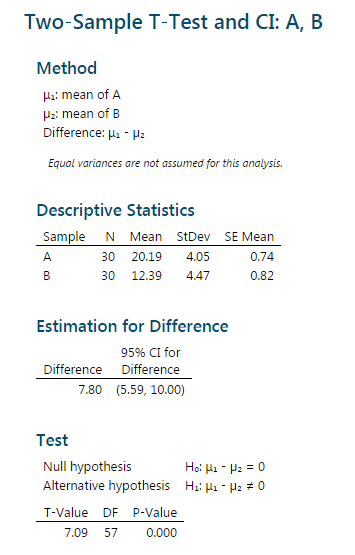
The results indicate that group A has a higher mean and that the difference is statistically significant. We’re not assuming equal variances, so it's not a problem that Group B has a slightly higher standard deviation. We also have enough observations per group that normality is not a concern. Concluding that group A has a higher mean than group B seems safe.
But wait a minute...let's look at each group in an I-MR chart.
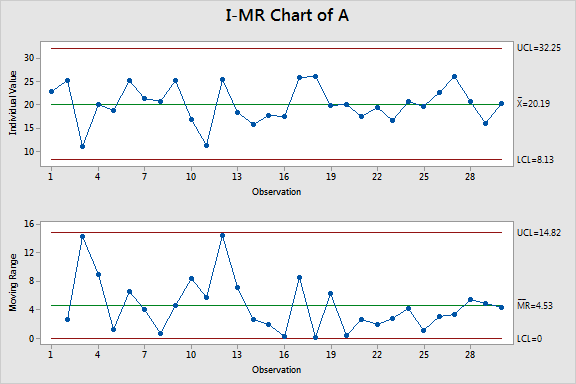
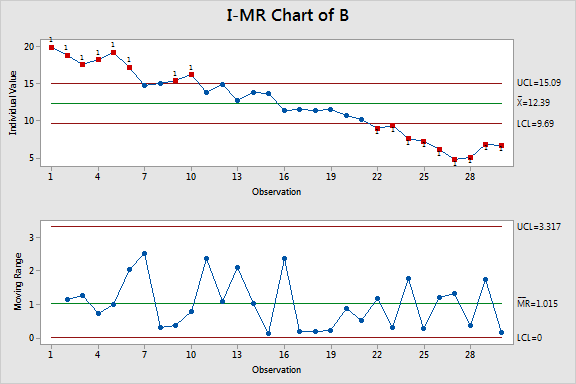
Group A's chart shows stable scores. But group B's chart indicates that the scores are unstable, with multiple out-of-control points and a clear negative trend. Even though these data satisfy the other assumptions, we can make a valid comparison between stable and an unstable groups!
This is not the only type of problem you can detect with control charts. They also can test for a variety of patterns in your data, and for out-of-control variability.
## Different Types of Control Charts
An I-MR chart can assess process stability when your data don’t have subgroups. The XBar-S chart, the first one in this post, assesses process stability when your data does havesubgroups.
Other control charts are ideal for other types of data. For example, the U Chart and Laney U’ Chart use the Poisson distribution. The P Chart and Laney P’ Chart use the binomial distribution.
In [Minitab Statistical Software](http://www.minitab.com/en-us/products/minitab/), you can get step-by-step guidance in control chart selection by going to **Assistant > Control Charts**. The Assistant will help you with everything from determining your data type, to ensuring it meets assumptions, to interpreting your results.
## You Might Also Like
[How Minitab's Analytics Help Solve Government Challenges](https://blog.minitab.com/en/blog/how-minitabs-analytics-help-solve-government-challenges?hsLang=en)
[Hypothesis Testing](https://blog.minitab.com/en/blog/tag/hypothesis-testing) | 6 Minute Read
[4 Ways to Measure Improvement Using Before/After Control Charts with Stages](https://blog.minitab.com/en/blog/4-ways-to-measure-improvement?hsLang=en)
[Control Charts](https://blog.minitab.com/en/blog/tag/control-charts) | 5 Minute Read
[Need Knee Surgery? A Before & After Control Chart Can Help You Decide](https://blog.minitab.com/en/blog/how-control-charts-can-show-improvement?hsLang=en)
[Control Charts](https://blog.minitab.com/en/blog/tag/control-charts) | 4 Minute Read
---
- [Careers](https://www.minitab.com/en-us/company/careers/)
- [Trust Center](https://www.minitab.com/en-us/trust-center/)
- [Suppliers](https://www.minitab.com/en-us/suppliers/)
- [Site Map](https://www.minitab.com/en-us/site-map/)
- [](https://www.linkedin.com/company/minitab/)
- [](https://www.facebook.com/Minitab/)
- [](https://www.youtube.com/user/MinitabInc)
- [](https://www.instagram.com/minitab/)
---
© 2025 Minitab, LLC. All Rights Reserved.
- [Terms of Use](https://www.minitab.com/en-us/legal/terms-of-use/)
- [Privacy Policy](https://www.minitab.com/en-us/legal/privacy-policy/)
- [Legal](https://www.minitab.com/en-us/legal/)
- Cookies Settings