---
title: 3 Common P-Value Mistakes You'll Never Make with Minitab
description: Read the 3 common P-value mistakes you'll never make, because Minitab Statistical software makes things easier by handling the arduous mathematical work involved in statistics.
image: https://blog.minitab.com/hubfs/B2BML%20-%20NEW%20FILE%20MANAGER%20STRUCTURE/Blog%20Images/Imported_Blog_Media/dialog-2-Jul-06-2025-12-21-04-0071-AM.png
---
English
- [English](https://blog.minitab.com/en/?hsLang=en)
- [Français](https://blog.minitab.com/fr/?hsLang=en)
- [Deutsch](https://blog.minitab.com/de/?hsLang=en)
- [Português](https://blog.minitab.com/pt/?hsLang=en)
- [Español](https://blog.minitab.com/es/?hsLang=en)
- [日本語](https://blog.minitab.com/ja/?hsLang=en)
- [한국어](https://blog.minitab.com/ko/?hsLang=en)
- [中文(简体)](https://blog.minitab.com/zh/?hsLang=en)
- [ Partners](https://www.minitab.com/en-us/company/partners/)
- [ Contact](https://www.minitab.com/en-us/company/contact-us/)
- [ Talk to Minitab](https://www.minitab.com/en-us/talk-to-minitab/)
- [ My Account](https://licensing.minitab.com/account/manage)
[](https://www.minitab.com/en-us/)
- Products
Back
[Products](https://www.minitab.com/en-us/products/)
[All Products](https://www.minitab.com/en-us/products/)
- [Minitab Solution Center](https://www.minitab.com/en-us/products/minitab-solution-center/)
- [Minitab Statistical Software](https://www.minitab.com/en-us/products/minitab/)
- [Minitab Connect](https://www.minitab.com/en-us/products/connect/)
- [Minitab Model Ops](https://www.minitab.com/en-us/products/model-ops/)
- [Minitab Education Hub](https://www.minitab.com/en-us/products/education-hub/)
- [Minitab Engage](https://www.minitab.com/en-us/products/engage/)
- [Minitab Workspace](https://www.minitab.com/en-us/products/workspace/)
- [Real-Time SPC](https://www.minitab.com/en-us/products/real-time-spc/)
- [Prolink Data Collection & SPC](https://www.minitab.com/en-us/products/prolink)
- [Simul8 Discrete Event Simulation](https://info.minitab.com/en/new-to-simul8?hsLang=en)
- [SPM](https://www.minitab.com/en-us/products/spm/)
- Solutions
Back
[Solutions](https://www.minitab.com/en-us/solutions/)
[All Solutions](https://www.minitab.com/en-us/solutions/)
- [Analytics](https://www.minitab.com/en-us/solutions/analytics/)
- [Statistics & Predictive Analytics](https://www.minitab.com/en-us/solutions/analytics/statistical-analysis-predictive-analytics/)
- [Data Science & Machine Learning](https://www.minitab.com/en-us/solutions/analytics/data-science-machine-learning/)
- [Business Analytics & Intelligence](https://www.minitab.com/en-us/solutions/analytics/business-analytics-intelligence/)
- [Statistical Process Control](https://www.minitab.com/en-us/solutions/analytics/statistical-process-control/)
- [Quality Analytics](https://www.minitab.com/en-us/solutions/analytics/quality-analytics/)
- [Live Analytics](https://www.minitab.com/en-us/solutions/analytics/live-analytics/)
- [Reliability & Life Data Analysis](https://www.minitab.com/en-us/solutions/analytics/reliability/)
- [Discrete Event Simulation](https://info.minitab.com/en/new-to-simul8?hsLang=en)
- [Process Mining](https://info.minitab.com/en/new-to-simul8?hsLang=en)
- [Key Capabilities](https://www.minitab.com/en-us/solutions/key-capabilities/)
- [Continuous Improvement](https://www.minitab.com/en-us/solutions/key-capabilities/continuous-improvement/)
- [Data Integration & Data Prep](https://www.minitab.com/en-us/solutions/key-capabilities/data-integration-data-prep/)
- [Diagramming & Mind Mapping](https://www.minitab.com/en-us/solutions/key-capabilities/diagramming-mind-mapping/)
- [Digital Twins](https://info.minitab.com/en/new-to-simul8?hsLang=en)
- [Model Deployment & ML Ops](https://www.minitab.com/en-us/solutions/key-capabilities/model-deployment-ml-ops/)
- [Innovation & Project Management](https://www.minitab.com/en-us/solutions/key-capabilities/innovation-project-management/)
- [Process Excellence: Detect, Correct & Prevent](https://www.minitab.com/en-us/solutions/key-capabilities/process-excellence/)
- [Featured Industries](https://www.minitab.com/en-us/solutions/industry/)
- [Academic](https://www.minitab.com/en-us/solutions/industry/academic/)
- [Energy & Natural Resources](https://www.minitab.com/en-us/solutions/industry/energy-resources/)
- [Government & Public Sector](https://www.minitab.com/en-us/solutions/industry/government/)
- [Healthcare](https://www.minitab.com/en-us/solutions/industry/healthcare/)
- [Insurance](https://www.minitab.com/en-us/solutions/industry/insurance/)
- [Manufacturing & Industrial](https://www.minitab.com/en-us/solutions/industry/manufacturing-industrial/)
- [Services](https://www.minitab.com/en-us/solutions/industry/service-industries/)
- [Software & Technology](https://www.minitab.com/en-us/solutions/industry/software-technology/)
- [Construction](https://www.minitab.com/en-us/solutions/industry/construction/)
- [Featured Roles](https://www.minitab.com/en-us/solutions/role/)
- [Engineering](https://www.minitab.com/en-us/solutions/role/engineering/)
- [Business Analysis](https://www.minitab.com/en-us/solutions/role/business-analysts/)
- [Information Technology](https://www.minitab.com/en-us/solutions/role/information-technology/)
- [Supply Chain](https://www.minitab.com/en-us/solutions/role/supply-chain/)
- [Customer Service & Contact Center](https://www.minitab.com/en-us/solutions/role/customer-service-contact-center/)
- [Human Resources](https://www.minitab.com/en-us/solutions/role/human-resources/)
- [Marketing](https://www.minitab.com/en-us/solutions/role/marketing/)
- [Research and Development](https://www.minitab.com/en-us/solutions/role/research-and-development/)
- Resources & Services
Back
[Resources & Services](https://www.minitab.com/en-us/resources-services/)
[All Resources & Services](https://www.minitab.com/en-us/resources-services/)
- [Resources](https://www.minitab.com/en-us/resources-services/resources/)
- [Case Studies](https://www.minitab.com/en-us/resources-services/resources/case-studies/)
- [eBooks & White Papers](https://www.minitab.com/en-us/resources-services/resources/ebooks-and-white-papers/)
- [Blog](https://blog.minitab.com/blog/?hsLang=en)
- [Data Sets](https://www.minitab.com/en-us/resources-services/resources/data-set/)
- [Webinars & Events](https://www.minitab.com/en-us/resources-services/resources/events/)
- [Education Hub](https://www.minitab.com/en-us/resources-services/resources/education-hub/)
- [Services](https://www.minitab.com/en-us/resources-services/services/)
- [Training](https://www.minitab.com/en-us/resources-services/services/training/)
- [Deployment](https://www.minitab.com/en-us/resources-services/services/deployment/)
- [Consulting](https://www.minitab.com/en-us/resources-services/services/statistical-consulting/)
- [Self-Paced Learning](https://www.minitab.com/en-us/resources-services/services/self-paced-learning/)
- [Continuing Education](https://www.minitab.com/en-us/resources-services/services/continuing-education/)
- Support
Back
[Support](https://www.minitab.com/en-us/support/)
[Technical Support](https://www.minitab.com/en-us/support/)
- [Subscriptions & Activation](https://www.minitab.com/en-us/support/subscriptions-and-activation/)
- [Minitab Quick Start](https://www.minitab.com/en-us/support/quick-start/)
- [Training](https://www.minitab.com/en-us/resources-services/services/training/)
- [Installation Support](https://www.minitab.com/en-us/support/installation/)
- [Support Videos](https://www.minitab.com/en-us/support/videos/)
- [Support Documentation](https://www.minitab.com/en-us/support/documents/)
- [Software Updates](https://www.minitab.com/en-us/support/software-updates/)
- [Product Downloads](https://www.minitab.com/en-us/support/downloads/)
- [Support Policy](https://www.minitab.com/en-us/support/policy/)
- Company
Back
[Company](https://www.minitab.com/en-us/company/)
[Company](https://www.minitab.com/en-us/company/)
- [About Us](https://www.minitab.com/en-us/company/our-company/)
- [Leadership Team](https://www.minitab.com/en-us/company/leadership-team/)
- [Partners](https://www.minitab.com/en-us/company/partners/)
- [Careers](https://www.minitab.com/en-us/company/careers/)
- [Contact](https://www.minitab.com/en-us/company/contact-us/)
- [News](https://www.minitab.com/en-us/company/press-releases/)
[Try/Buy](https://www.minitab.com/en-us/try-buy/)
- [Statistics](https://blog.minitab.com/en/blog/tag/statistics)
- [Data Analysis](https://blog.minitab.com/en/blog/tag/data-analysis)
-
- [Quality Improvement](https://blog.minitab.com/en/blog/tag/quality-improvement)
- [Subscribe](https://info.minitab.com/blog/subscribe?hsLang=en)

## Notice
You are now leaving minitab.com.
Click Continue to proceed to:
Continue
Go Back
# 3 Common P-Value Mistakes You'll Never Make with Minitab
Minitab Blog Editor | 2/22/2017
Topics: [Statistics](https://blog.minitab.com/en/blog/tag/statistics), [Hypothesis Testing](https://blog.minitab.com/en/blog/tag/hypothesis-testing)
- [Share](https://www.linkedin.com/shareArticle?mini=true&url=https://blog.minitab.com/en/blog/understanding-statistics/three-common-p-value-mistakes-youll-never-have-to-make)
- [Share](https://www.facebook.com/sharer.php?u=https://blog.minitab.com/en/blog/understanding-statistics/three-common-p-value-mistakes-youll-never-have-to-make)
Statistics can be challenging, especially if you're not analyzing data and interpreting the results every day. [Statistical software](http://www.minitab.com/products/minitab/) makes things easier by handling the arduous mathematical work involved in statistics. But ultimately, we're responsible for correctly interpreting and communicating what the results of our analyses show.
The p-value is probably the most frequently cited statistic. We use p-values to interpret the results of regression analysis, hypothesis tests, and many other methods. Every introductory statistics student and every Lean Six Sigma Green Belt learns about p-values.
Yet this common statistic is misinterpreted so often that at least one scientific journal has abandoned its use.
## What Does a P-value Tell You?
Typically, a P value is defined as "the probability of observing an effect at least as extreme as the one in your sample data—*if the [null hypothesis](https://blog.minitab.com/blog/understanding-statistics/why-shrewd-experts-fail-to-reject-the-null-every-time?hsLang=en) is true*." Thus, the only question a p-value can answer is this one:
*How likely is it that I would get the data I have, assuming the null hypothesis is true?*
If your p-value is less than your selected [alpha level](https://blog.minitab.com/blog/adventures-in-statistics-2/understanding-hypothesis-tests%3A-significance-levels-alpha-and-p-values-in-statistics) (typically 0.05), you *reject the null hypothesis* in favor of the alternative hypothesis. If the p-value is above your alpha value, you *fail to reject* the null hypothesis. It's important to note that the null hypothesis is never accepted; we can only *reject* or *fail to reject* it.
## The P-Value in a 2-Sample t-Test
Consider a typical hypothesis test—say, a 2-sample t-test of the mean weight of boxes of cereal filled at different facilities. We collect and weigh 50 boxes from each facility to confirm that the mean weight for each line's boxes is the listed package weight of 14 oz.
Our null hypothesis is that the two means are equal. Our alternative hypothesis is that they are *not* equal.
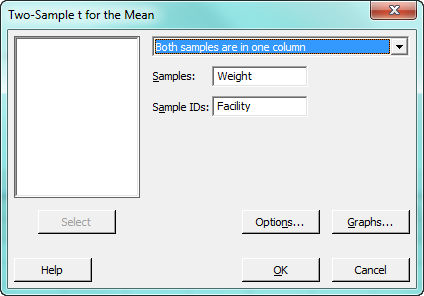
To run this test in Minitab, we enter our data in a worksheet and select **Stat > Basic Statistics > 2-Sample T-test**. If you'd like to follow along, you can download the [data](https://cdn.app.compendium.com/uploads/user/458939f4-fe08-4dbc-b271-efca0f5a2682/479b4fbd-f8c0-4011-9409-f4109cc4c745/Image/2edc594cf40ec4931e5cd0021df6703e/cereal_weight.mtw) and, if you don't already have it, get the [15-day trial of Minitab](http://www.minitab.com/products/minitab/free-trial/). In the t-test dialog box, select *Both samples are in one column* from the drop-down menu, and choose "Weight" for Samples, and "Facility" for Sample IDs.
Minitab gives us the following output, and I've highlighted the p-value for the hypothesis test:
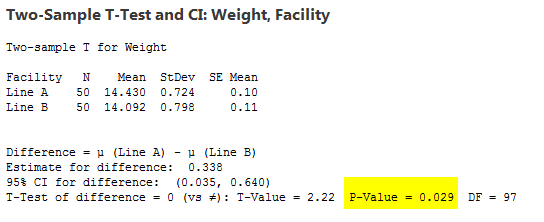
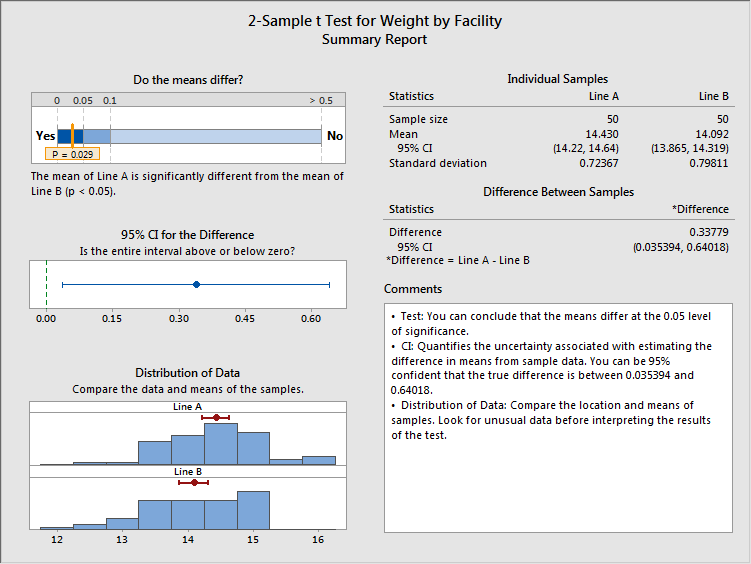
So we have a p-value of 0.029, which is less than our selected alpha value of 0.05. Therefore, we reject the null hypothesis that the means of Line A and Line B are equal. Note also that while the evidence indicates the means are different, that difference is estimated at 0.338 oz—a pretty small amount of cereal.
So far, so good. But this is the point at which trouble often starts.
## Three Frequent Misstatements about P-Values
The p-value of 0.029 means we reject the null hypothesis that the means are equal. But that doesn't mean any of the following statements are accurate:
1. **"There is 2.9% probability the means are the same, and 97.1% probability they are different." **
We don't know that at all. The p-value only says that ***if ***the null hypothesis is true, the sample data collected would exhibit a difference this large or larger only 2.9% of the time. Remember that the p-value doesn't tell you anything *directly* about what you've seen. Instead, it tells you the *odds* of seeing it.
2. **"The p-value is low, which indicates there's an important difference in the means." **
Based on the 0.029 p-value shown above, we can conclude that a statistically significant difference between the means exists. But the estimated size of that difference is less than a half-ounce, and won't matter to customers. A p-value may indicate a difference exists, but it tells you nothing about its practical impact.
3. **"The low p-value shows the alternative hypothesis is true."**
A low p-value provides statistical evidence to reject the null hypothesis—but that doesn't prove the truth of the alternative hypothesis. If your alpha level is 0.05, there's a 5% chance you will incorrectly reject the null hypothesis. Or to put it another way, if a jury fails to convict a defendant, it doesn't prove the defendant is *innocent*: it only means the prosecution failed to prove the defendant's guilt beyond a reasonable doubt.
These misinterpretations happen frequently enough to be a concern, but that doesn't mean that we shouldn't use p-values to help interpret data. The p-value remains a very useful tool, as long as we're interpreting and communicating its significance accurately.
## P-Value Results in Plain Language
It's one thing to keep all of this straight if you're doing data analysis and statistics all the time. It's another thing if you're only analyze data occasionally, and need to do many other things in between—like most of us. "Use it or lose it" is certainly true about statistical knowledge, which could well be another factor that contributes to misinterpreted p-values.
If you're leery of that happening to you, a good way to avoid that possibility is to use the Assistant in Minitab to perform your analyses. If you haven't used it yet, the Assistant menu guides you through your analysis from start to finish. The dialog boxes and output are all in plain language, so it's easy to figure out what you need to do and what the results mean, even if it's been a while since your last analysis. (But even expert statisticians tell us they like using the Assistant because the output is so clear and easy to understand, regardless of an audience's statistical background.)
So let's redo the analysis above using the Assistant, to see what that output looks like and how it can help you avoid misinterpreting your results—or having them be misunderstood by others!
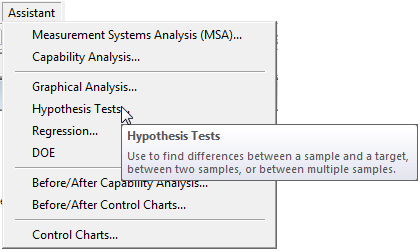
Start by selecting **Assistant > Hypothesis Test...** from the Minitab menu. Note that a window pops up to explain exactly what a hypothesis test does.
The Assistant asks what we're trying to do, and gives us three options to choose from.
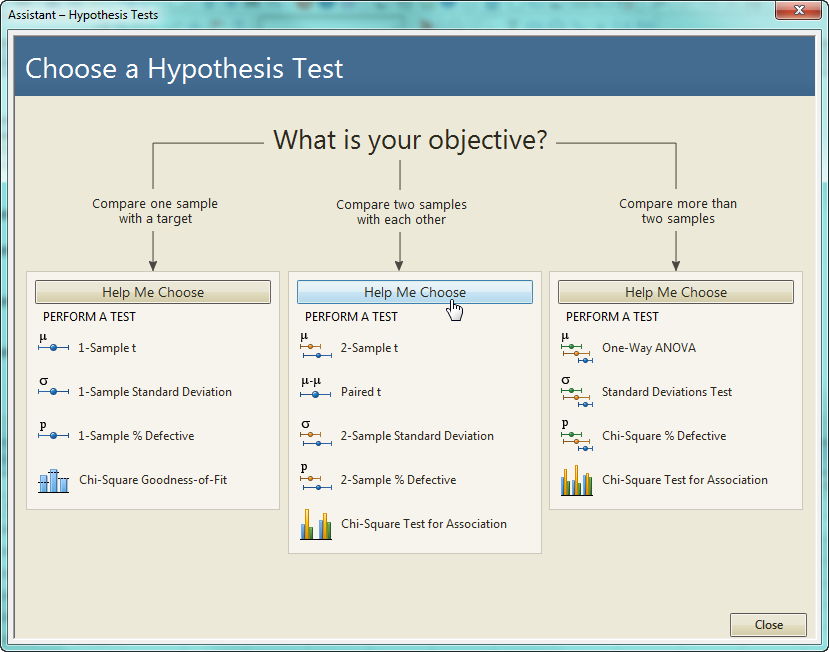
We know we want to compare a sample from Line A with a sample from Line B, but what if we can't remember which of the 5 available tests is the appropriate one in this situation? We can get guidance by clicking "Help Me Choose."
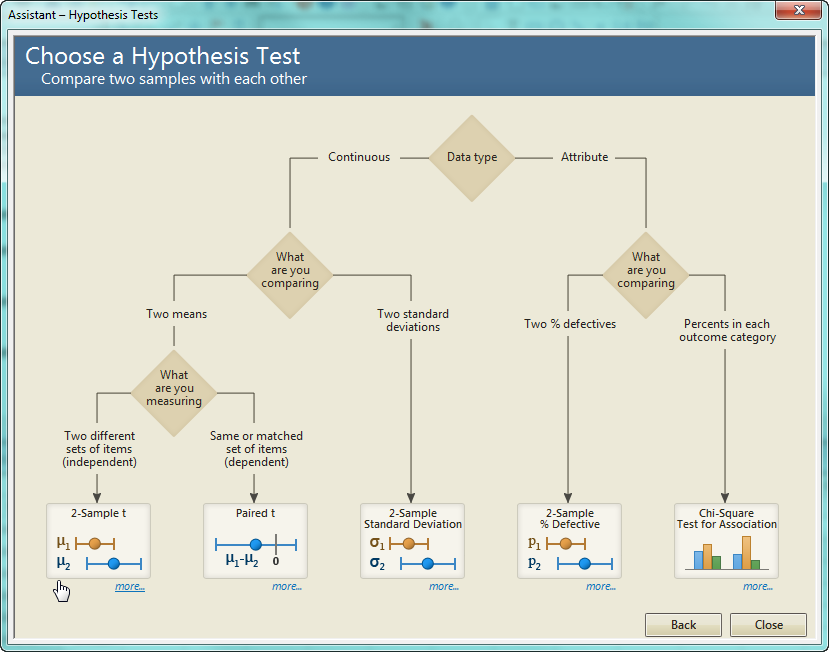
The choices on the diagram direct us to the appropriate test. In this case, we choose continuous data instead of attribute (and even if we'd forgotten the difference, clicking on the diamond would explain it). We're comparing two means instead of two standard deviations, and we're measuring two different sets of items since our boxes came from different production lines.
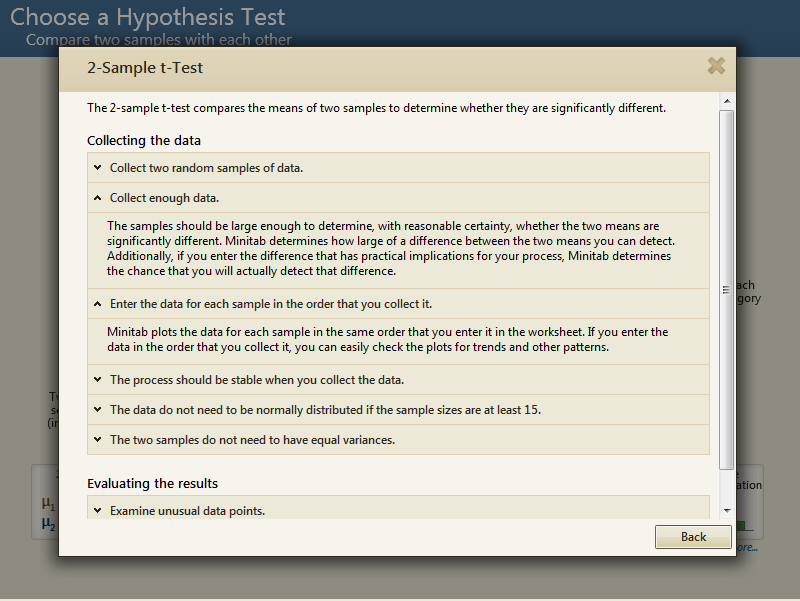
Now we know what test to use, but suppose you want to make sure you don't miss anything that's important about the test, like requirements that must be met? Click the "more..." link and you'll get those details.
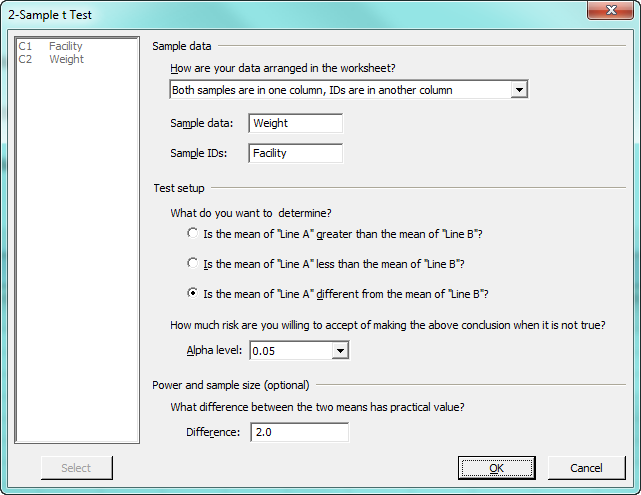
Now we can proceed to the Assistant's dialog box. Again, statistical jargon is minimized and everything is put in straightforward language. We just need to answer a few questions, as shown. Note that the Assistant even lets us tell it how big a difference needs to be for us to consider it practically important. In this case, we'll enter 2 ounces.
When we press OK, the Assistant performs the t-test and delivers three reports. The first of these is a summary report, which includes summary statistics, confidence intervals, histograms of both samples, and more. And interpreting the results couldn't be more straightforward than what we see in the top left quadrant of the diagram. In response to the question, "Do the means differ?" we can see that p-value of 0.029 marked on the bar, very far toward the "Yes" end of the scale.
Next is the Diagnostic Report, which provides additional information about the test.
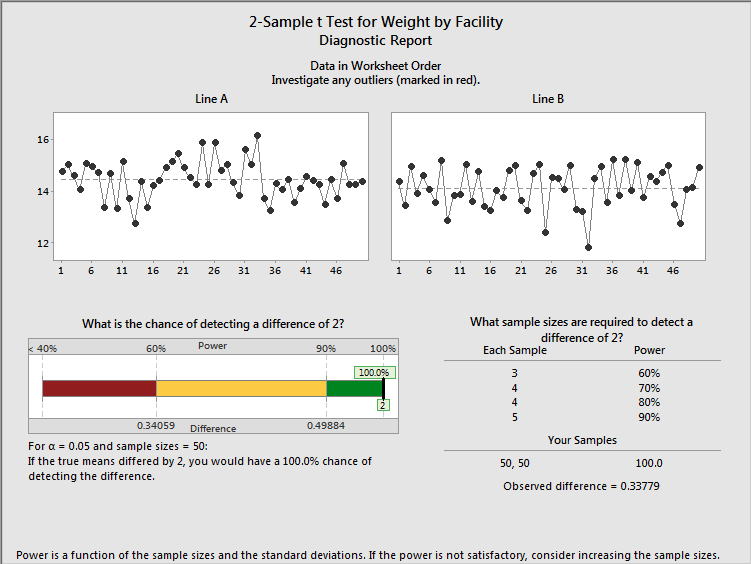
In addition to letting us check for outliers, the diagnostic report shows us the size of the observed difference, as well as the chances that our test could detect a practically significant difference of 2 oz.
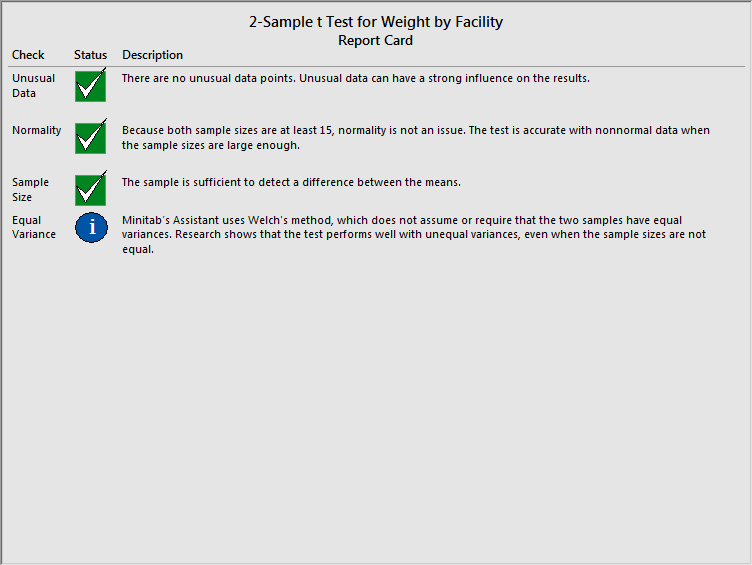
The final piece of output the Assistant provides is the report card, which flags any problems or concerns about the test that we would need to be aware of. In this case, all of the boxes are green and checked (instead of red and x'ed).
When you're not doing statistics all the time, the Assistant makes it a breeze to find the right analysis for your situation and to make sure you interpret your results the right way. Using it is a great way to make sure you're not attaching too much, or too little, importance on the results of your analyses.
#### See how your company can learn to effectively utilize data to make smarter decisions. [Learn more about our Training Services today!](https://www.minitab.com/en-us/resources-services/services/training/)
## You Might Also Like
[How Minitab's Analytics Help Solve Government Challenges](https://blog.minitab.com/en/blog/how-minitabs-analytics-help-solve-government-challenges?hsLang=en)
[Hypothesis Testing](https://blog.minitab.com/en/blog/tag/hypothesis-testing) | 6 Minute Read
[IT vs. OT: Unlocking the Power of Convergence](https://blog.minitab.com/en/blog/it-vs.-ot-unlocking-the-power-of-convergence?hsLang=en)
[Operations](https://blog.minitab.com/en/blog/tag/operations) | 6 Minute Read
[Minitab Analysis Reveals Surprising Traveler Preferences for Top Vacation Rental Provider](https://blog.minitab.com/en/blog/customer-preferences-revealed-vacation-rental-provider?hsLang=en)
[Hypothesis Testing](https://blog.minitab.com/en/blog/tag/hypothesis-testing) | 3 Minute Read
---
- [Careers](https://www.minitab.com/en-us/company/careers/)
- [Trust Center](https://www.minitab.com/en-us/trust-center/)
- [Suppliers](https://www.minitab.com/en-us/suppliers/)
- [Site Map](https://www.minitab.com/en-us/site-map/)
- [](https://www.linkedin.com/company/minitab/)
- [](https://www.facebook.com/Minitab/)
- [](https://www.youtube.com/user/MinitabInc)
- [](https://www.instagram.com/minitab/)
---
© 2025 Minitab, LLC. All Rights Reserved.
- [Terms of Use](https://www.minitab.com/en-us/legal/terms-of-use/)
- [Privacy Policy](https://www.minitab.com/en-us/legal/privacy-policy/)
- [Legal](https://www.minitab.com/en-us/legal/)
- Cookies Settings