---
title: Using Probability Distribution Plots to See Data Clearly
description: Visualize your data with probability distribution plots. Understand complex statistics, make informed decisions, and communicate results effectively using Minitab.
image: https://blog.minitab.com/hubfs/B2BML%20-%20NEW%20FILE%20MANAGER%20STRUCTURE/Blog%20Images/Imported_Blog_Media/Using%20Probability%20Distribution%20Plots%20to%20See%20Data%20Clearly.jpg
---
English
- [English](https://blog.minitab.com/en/?hsLang=en)
- [Français](https://blog.minitab.com/fr/?hsLang=en)
- [Deutsch](https://blog.minitab.com/de/?hsLang=en)
- [Português](https://blog.minitab.com/pt/?hsLang=en)
- [Español](https://blog.minitab.com/es/?hsLang=en)
- [日本語](https://blog.minitab.com/ja/?hsLang=en)
- [한국어](https://blog.minitab.com/ko/?hsLang=en)
- [中文(简体)](https://blog.minitab.com/zh/?hsLang=en)
- [ Partners](https://www.minitab.com/en-us/company/partners/)
- [ Contact](https://www.minitab.com/en-us/company/contact-us/)
- [ Talk to Minitab](https://www.minitab.com/en-us/talk-to-minitab/)
- [ My Account](https://licensing.minitab.com/account/manage)
[](https://www.minitab.com/en-us/)
- Products
Back
[Products](https://www.minitab.com/en-us/products/)
[All Products](https://www.minitab.com/en-us/products/)
- [Minitab Solution Center](https://www.minitab.com/en-us/products/minitab-solution-center/)
- [Minitab Statistical Software](https://www.minitab.com/en-us/products/minitab/)
- [Minitab Connect](https://www.minitab.com/en-us/products/connect/)
- [Minitab Model Ops](https://www.minitab.com/en-us/products/model-ops/)
- [Minitab Education Hub](https://www.minitab.com/en-us/products/education-hub/)
- [Minitab Engage](https://www.minitab.com/en-us/products/engage/)
- [Minitab Workspace](https://www.minitab.com/en-us/products/workspace/)
- [Real-Time SPC](https://www.minitab.com/en-us/products/real-time-spc/)
- [Prolink Data Collection & SPC](https://www.minitab.com/en-us/products/prolink)
- [Simul8 Discrete Event Simulation](https://info.minitab.com/en/new-to-simul8?hsLang=en)
- [SPM](https://www.minitab.com/en-us/products/spm/)
- Solutions
Back
[Solutions](https://www.minitab.com/en-us/solutions/)
[All Solutions](https://www.minitab.com/en-us/solutions/)
- [Analytics](https://www.minitab.com/en-us/solutions/analytics/)
- [Statistics & Predictive Analytics](https://www.minitab.com/en-us/solutions/analytics/statistical-analysis-predictive-analytics/)
- [Data Science & Machine Learning](https://www.minitab.com/en-us/solutions/analytics/data-science-machine-learning/)
- [Business Analytics & Intelligence](https://www.minitab.com/en-us/solutions/analytics/business-analytics-intelligence/)
- [Statistical Process Control](https://www.minitab.com/en-us/solutions/analytics/statistical-process-control/)
- [Quality Analytics](https://www.minitab.com/en-us/solutions/analytics/quality-analytics/)
- [Live Analytics](https://www.minitab.com/en-us/solutions/analytics/live-analytics/)
- [Reliability & Life Data Analysis](https://www.minitab.com/en-us/solutions/analytics/reliability/)
- [Discrete Event Simulation](https://info.minitab.com/en/new-to-simul8?hsLang=en)
- [Process Mining](https://info.minitab.com/en/new-to-simul8?hsLang=en)
- [Key Capabilities](https://www.minitab.com/en-us/solutions/key-capabilities/)
- [Continuous Improvement](https://www.minitab.com/en-us/solutions/key-capabilities/continuous-improvement/)
- [Data Integration & Data Prep](https://www.minitab.com/en-us/solutions/key-capabilities/data-integration-data-prep/)
- [Diagramming & Mind Mapping](https://www.minitab.com/en-us/solutions/key-capabilities/diagramming-mind-mapping/)
- [Digital Twins](https://info.minitab.com/en/new-to-simul8?hsLang=en)
- [Model Deployment & ML Ops](https://www.minitab.com/en-us/solutions/key-capabilities/model-deployment-ml-ops/)
- [Innovation & Project Management](https://www.minitab.com/en-us/solutions/key-capabilities/innovation-project-management/)
- [Process Excellence: Detect, Correct & Prevent](https://www.minitab.com/en-us/solutions/key-capabilities/process-excellence/)
- [Featured Industries](https://www.minitab.com/en-us/solutions/industry/)
- [Academic](https://www.minitab.com/en-us/solutions/industry/academic/)
- [Energy & Natural Resources](https://www.minitab.com/en-us/solutions/industry/energy-resources/)
- [Government & Public Sector](https://www.minitab.com/en-us/solutions/industry/government/)
- [Healthcare](https://www.minitab.com/en-us/solutions/industry/healthcare/)
- [Insurance](https://www.minitab.com/en-us/solutions/industry/insurance/)
- [Manufacturing & Industrial](https://www.minitab.com/en-us/solutions/industry/manufacturing-industrial/)
- [Services](https://www.minitab.com/en-us/solutions/industry/service-industries/)
- [Software & Technology](https://www.minitab.com/en-us/solutions/industry/software-technology/)
- [Construction](https://www.minitab.com/en-us/solutions/industry/construction/)
- [Featured Roles](https://www.minitab.com/en-us/solutions/role/)
- [Engineering](https://www.minitab.com/en-us/solutions/role/engineering/)
- [Business Analysis](https://www.minitab.com/en-us/solutions/role/business-analysts/)
- [Information Technology](https://www.minitab.com/en-us/solutions/role/information-technology/)
- [Supply Chain](https://www.minitab.com/en-us/solutions/role/supply-chain/)
- [Customer Service & Contact Center](https://www.minitab.com/en-us/solutions/role/customer-service-contact-center/)
- [Human Resources](https://www.minitab.com/en-us/solutions/role/human-resources/)
- [Marketing](https://www.minitab.com/en-us/solutions/role/marketing/)
- [Research and Development](https://www.minitab.com/en-us/solutions/role/research-and-development/)
- Resources & Services
Back
[Resources & Services](https://www.minitab.com/en-us/resources-services/)
[All Resources & Services](https://www.minitab.com/en-us/resources-services/)
- [Resources](https://www.minitab.com/en-us/resources-services/resources/)
- [Case Studies](https://www.minitab.com/en-us/resources-services/resources/case-studies/)
- [eBooks & White Papers](https://www.minitab.com/en-us/resources-services/resources/ebooks-and-white-papers/)
- [Blog](https://blog.minitab.com/blog/?hsLang=en)
- [Data Sets](https://www.minitab.com/en-us/resources-services/resources/data-set/)
- [Webinars & Events](https://www.minitab.com/en-us/resources-services/resources/events/)
- [Education Hub](https://www.minitab.com/en-us/resources-services/resources/education-hub/)
- [Services](https://www.minitab.com/en-us/resources-services/services/)
- [Training](https://www.minitab.com/en-us/resources-services/services/training/)
- [Deployment](https://www.minitab.com/en-us/resources-services/services/deployment/)
- [Consulting](https://www.minitab.com/en-us/resources-services/services/statistical-consulting/)
- [Self-Paced Learning](https://www.minitab.com/en-us/resources-services/services/self-paced-learning/)
- [Continuing Education](https://www.minitab.com/en-us/resources-services/services/continuing-education/)
- Support
Back
[Support](https://www.minitab.com/en-us/support/)
[Technical Support](https://www.minitab.com/en-us/support/)
- [Subscriptions & Activation](https://www.minitab.com/en-us/support/subscriptions-and-activation/)
- [Minitab Quick Start](https://www.minitab.com/en-us/support/quick-start/)
- [Training](https://www.minitab.com/en-us/resources-services/services/training/)
- [Installation Support](https://www.minitab.com/en-us/support/installation/)
- [Support Videos](https://www.minitab.com/en-us/support/videos/)
- [Support Documentation](https://www.minitab.com/en-us/support/documents/)
- [Software Updates](https://www.minitab.com/en-us/support/software-updates/)
- [Product Downloads](https://www.minitab.com/en-us/support/downloads/)
- [Support Policy](https://www.minitab.com/en-us/support/policy/)
- Company
Back
[Company](https://www.minitab.com/en-us/company/)
[Company](https://www.minitab.com/en-us/company/)
- [About Us](https://www.minitab.com/en-us/company/our-company/)
- [Leadership Team](https://www.minitab.com/en-us/company/leadership-team/)
- [Partners](https://www.minitab.com/en-us/company/partners/)
- [Careers](https://www.minitab.com/en-us/company/careers/)
- [Contact](https://www.minitab.com/en-us/company/contact-us/)
- [News](https://www.minitab.com/en-us/company/press-releases/)
[Try/Buy](https://www.minitab.com/en-us/try-buy/)
- [Statistics](https://blog.minitab.com/en/blog/tag/statistics)
- [Data Analysis](https://blog.minitab.com/en/blog/tag/data-analysis)
-
- [Quality Improvement](https://blog.minitab.com/en/blog/tag/quality-improvement)
- [Subscribe](https://info.minitab.com/blog/subscribe?hsLang=en)

## Notice
You are now leaving minitab.com.
Click Continue to proceed to:
Continue
Go Back
# Using Probability Distribution Plots to See Data Clearly
Minitab Blog Editor | 8/20/2015
Topics: [Data Analysis](https://blog.minitab.com/en/blog/tag/data-analysis), [Statistics](https://blog.minitab.com/en/blog/tag/statistics)
- [Share](https://www.linkedin.com/shareArticle?mini=true&url=https://blog.minitab.com/en/blog/understanding-statistics/using-probability-distribution-plots-to-see-data-clearly)
- [Share](https://www.facebook.com/sharer.php?u=https://blog.minitab.com/en/blog/understanding-statistics/using-probability-distribution-plots-to-see-data-clearly)
When we take pictures with a digital camera or smartphone, what the device *really* does is capture information in the form of binary code. At the most basic level, our precious photos are really just a bunch of 1s and 0s, but if we were to look at them that way, they'd be pretty unexciting.
In its raw state, all that information the camera records is worthless. The 1s and 0s need to be converted into pictures before we can actually see what we've photographed.
We encounter a similar situation when we try to use [statistical distributions and parameters](https://blog.minitab.com/blog/adventures-in-statistics/how-to-identify-the-distribution-of-your-data-using-minitab?hsLang=en) to describe data. There's important information there, but it can seem like a bunch of meaningless numbers without an illustration that makes them easier to interpret.
For instance, if you have data that follows a gamma distribution with a scale of 8 and a shape of 7, what does that really mean? If the distribution shifts to a shape of 10, is that good or bad? And even if *you* understand it, how easy would it be explain to people who are more interested in outcomes than statistics?
## Enter the Probability Distribution Plot
That's where the probability distribution plot comes in. Making a probability distribution plot using [Minitab Statistical Software](https://www.minitab.com/en-us/products/minitab/) will create a picture that helps bring the numbers to life. Even novices can benefit from understanding their data’s distribution.
Let's take a look at a few examples.
## Changing Shape
A building materials manufacturer develops a new process to increase the strength of its I-beams. The old process fit a gamma distribution with a scale of 8 and a shape of 7, whereas the new process has a shape of 10.
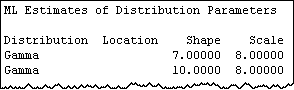
The manufacturer does not know what this change in the shape parameter means, and the numbers alone don't tell the story.
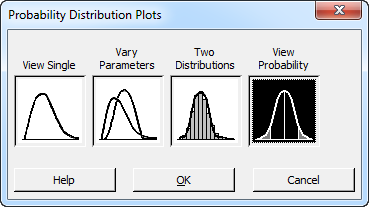
But if we go in Minitab to **Graph > Probability Distribution Plot**, select the "View Probability" option, and enter the information about these distributions, the impact of the change will be revealed.
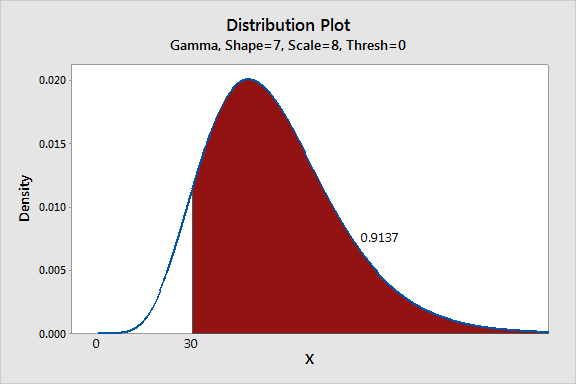
Here's the original process, with the shape of 7:
And here is the plot for the new process, with a shape of 10:
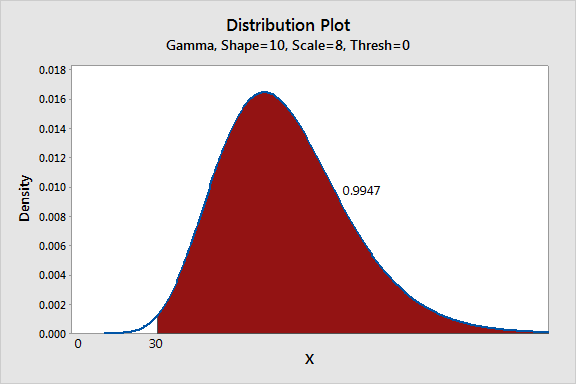
The probability distribution plots make it easy to see that the shape change increases the number of acceptable beams from 91.4% to 99.5%, an 8.1% improvement. What's more, the right tail appears to be much thicker in the second graph, which indicates the new process creates many more unusually strong units. Hmmm...maybe the new process could ultimately lead to a premium line of products.
## Communicating Results
Suppose a chain of department stores is considering a new program to reduce discrepancies between an item’s tagged price and the amount is charged at the register. Ideally, the system would eliminate any discrepancies, but a ± 0.5% difference is considered acceptable. However, implementing the program will be extremely expensive, so the company runs a pilot test in a single store.
In the pilot study, the mean improvement is small, and so is the standard deviation. When the company's board looks at the numbers, they don't see the benefits of approving the program, given its cost.
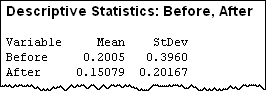
The store's quality specialist thinks the numbers aren't telling the story, and decides to show the board the pilot test data in a probability distribution plot instead:
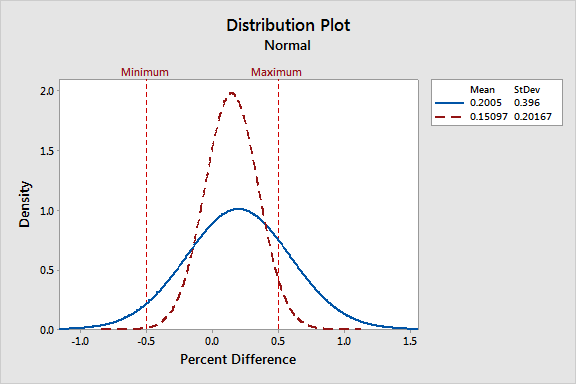
By overlaying the before and after distributions, the specialist makes it very easy to see that price differences using the new system are clustered much closer to zero, and most are in the ± 0.5% acceptable range. Now the board can see the impact of adopting the new system.
## Comparing Distributions
An electronics manufacturer counts the number of printed circuit boards that are completed per hour. The sample data is best described by a Poisson distribution with a mean of 3.2. However, the company's test lab prefers to use [an analysis that requires a normal distribution](https://blog.minitab.com/blog/quality-data-analysis-and-statistics/assumptions-and-normality?hsLang=en) and wants to know if it is appropriate.
The manufacturer can easily compare the known distribution with a normal distribution using the probability distribution plot. If the normal distribution does not approximate the Poisson distribution, then the lab's test results will be invalid.
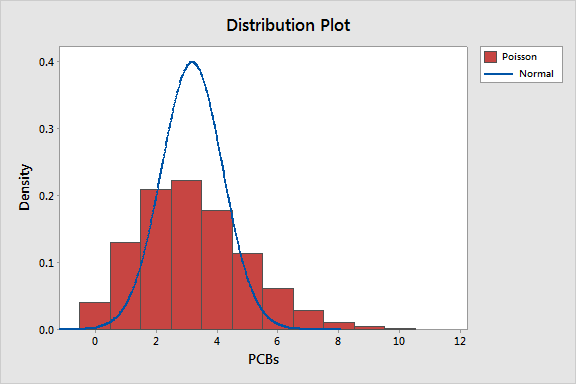
As the graph indicates, the normal distribution—and the analyses that require it—won’t be a good fit for data that follow a Poisson distribution with a mean of 3.2.
## Creating Probability Distribution Plots in Minitab
It's easy to use Minitab to create plots to visualize and to compare distributions and even to scrutinize an area of interest.
Let's say a market researcher wants to interview customers with satisfaction scores between 115 and 135. Minitab’s Individual Distribution Identification feature shows that these scores are normally distributed with a mean of 100 and a standard deviation of 15. However, the analyst can’t visualize where his subjects fall within the range of scores or their proportion of the entire distribution.
Choose **Graph > Probability Distribution Plot > View Probability**.
Click **OK**.
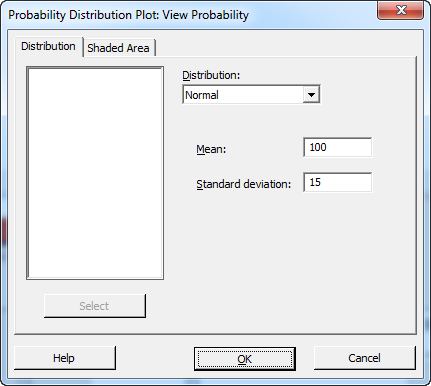
1. From Distribution, choose Normal.
2. In Mean, type 100.
3. In Standard deviation, type 15.
4. Click on the "Shaded Area" tab.
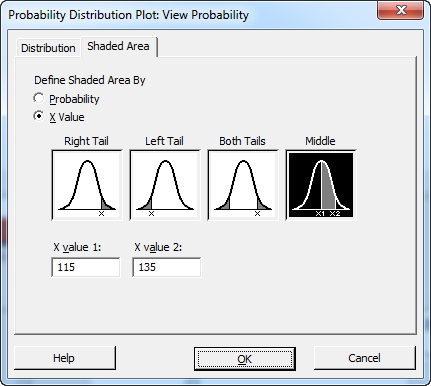
1. In Define Shaded Area By, choose X Value.
2. Click Middle.
3. In X value 1, type 115.
4. In X value 2, type 135.
5. Click OK.
Minitab creates the following plot:
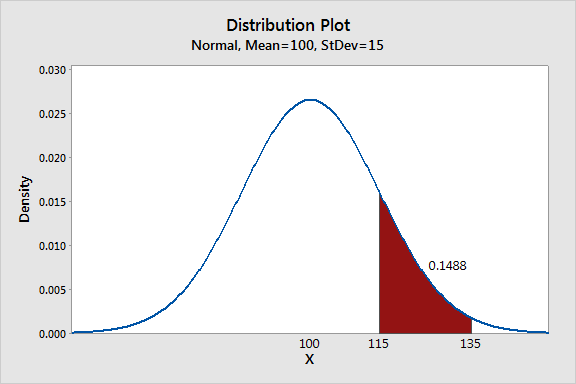
About 15% of sampled customers had scores in the region of interest (115-135). This is not a very large percentage, so the researcher may face challenges in finding qualified subjects.
## Using Probability Distribution Plots
Just like your camera when it assembles 1s and 0s into pictures, probability distribution plots let you see the deeper meaning of the numbers that describe your distributions. You can use these graphs to highlight the impact of changing distributions and parameter values, to show where target values fall in a distribution, and to view the proportions that are associated with shaded areas. These simple plots also clearly and easily communicate these advanced concepts to a non-statistical audience that might be confused by hard-to-understand concepts and numbers.
## Boost Your Data Skills. Explore Training Options today!
[](https://cta-redirect.hubspot.com/cta/redirect/3447555/779bcbe2-e3fe-46ae-9312-1a3a36fbac1b)
## You Might Also Like
[New Minitab Updates Unite Data Collection, Preparation, and Predictive Analytics](https://blog.minitab.com/en/blog/new-minitab-updates-unite-data-collection-preparation-and-predictive-analytics?hsLang=en)
[Data Preparation](https://blog.minitab.com/en/blog/tag/data-preparation) | 5 Minute Read
[Artemis II Heat Shield: How Do You Decide in Uncertain Conditions?](https://blog.minitab.com/en/blog/artemis-ii-heat-shield-how-do-you-decide-under-uncertainty?hsLang=en)
[Data Analysis](https://blog.minitab.com/en/blog/tag/data-analysis) | 4 Minute Read
[6 Trends Shaping Business Decisions in 2026](https://blog.minitab.com/en/blog/6-trends-shaping-business-decisions-in-2026?hsLang=en)
[Oee](https://blog.minitab.com/en/blog/tag/oee) | 8 Minute Read
---
- [Careers](https://www.minitab.com/en-us/company/careers/)
- [Trust Center](https://www.minitab.com/en-us/trust-center/)
- [Suppliers](https://www.minitab.com/en-us/suppliers/)
- [Site Map](https://www.minitab.com/en-us/site-map/)
- [](https://www.linkedin.com/company/minitab/)
- [](https://www.facebook.com/Minitab/)
- [](https://www.youtube.com/user/MinitabInc)
- [](https://www.instagram.com/minitab/)
---
© 2025 Minitab, LLC. All Rights Reserved.
- [Terms of Use](https://www.minitab.com/en-us/legal/terms-of-use/)
- [Privacy Policy](https://www.minitab.com/en-us/legal/privacy-policy/)
- [Legal](https://www.minitab.com/en-us/legal/)
- Cookies Settings