---
title: "Understanding t-Tests: Why Degrees of Freedom Appeared in Minitab (and Why They Matter)"
description: Interpret and report t-test results with greater confidence by understanding why Minitab now displays Degrees of Freedom and how they improve transparency and precision.
image: https://blog.minitab.com/hubfs/personatcomputer.png
---
English
- [English](https://blog.minitab.com/en/?hsLang=en)
- [Français](https://blog.minitab.com/fr/?hsLang=en)
- [Deutsch](https://blog.minitab.com/de/?hsLang=en)
- [Português](https://blog.minitab.com/pt/?hsLang=en)
- [Español](https://blog.minitab.com/es/?hsLang=en)
- [日本語](https://blog.minitab.com/ja/?hsLang=en)
- [한국어](https://blog.minitab.com/ko/?hsLang=en)
- [中文(简体)](https://blog.minitab.com/zh/?hsLang=en)
- [ Partners](https://www.minitab.com/en-us/company/partners/)
- [ Contact](https://www.minitab.com/en-us/company/contact-us/)
- [ Talk to Minitab](https://www.minitab.com/en-us/talk-to-minitab/)
- [ My Account](https://licensing.minitab.com/account/manage)
[](https://www.minitab.com/en-us/)
- Products
Back
[Products](https://www.minitab.com/en-us/products/)
[All Products](https://www.minitab.com/en-us/products/)
- [Minitab Solution Center](https://www.minitab.com/en-us/products/minitab-solution-center/)
- [Minitab Statistical Software](https://www.minitab.com/en-us/products/minitab/)
- [Minitab Connect](https://www.minitab.com/en-us/products/connect/)
- [Minitab Model Ops](https://www.minitab.com/en-us/products/model-ops/)
- [Minitab Education Hub](https://www.minitab.com/en-us/products/education-hub/)
- [Minitab Engage](https://www.minitab.com/en-us/products/engage/)
- [Minitab Workspace](https://www.minitab.com/en-us/products/workspace/)
- [Real-Time SPC](https://www.minitab.com/en-us/products/real-time-spc/)
- [Prolink Data Collection & SPC](https://www.minitab.com/en-us/products/prolink)
- [Simul8 Discrete Event Simulation](https://info.minitab.com/en/new-to-simul8?hsLang=en)
- [SPM](https://www.minitab.com/en-us/products/spm/)
- Solutions
Back
[Solutions](https://www.minitab.com/en-us/solutions/)
[All Solutions](https://www.minitab.com/en-us/solutions/)
- [Analytics](https://www.minitab.com/en-us/solutions/analytics/)
- [Statistics & Predictive Analytics](https://www.minitab.com/en-us/solutions/analytics/statistical-analysis-predictive-analytics/)
- [Data Science & Machine Learning](https://www.minitab.com/en-us/solutions/analytics/data-science-machine-learning/)
- [Business Analytics & Intelligence](https://www.minitab.com/en-us/solutions/analytics/business-analytics-intelligence/)
- [Statistical Process Control](https://www.minitab.com/en-us/solutions/analytics/statistical-process-control/)
- [Quality Analytics](https://www.minitab.com/en-us/solutions/analytics/quality-analytics/)
- [Live Analytics](https://www.minitab.com/en-us/solutions/analytics/live-analytics/)
- [Reliability & Life Data Analysis](https://www.minitab.com/en-us/solutions/analytics/reliability/)
- [Discrete Event Simulation](https://info.minitab.com/en/new-to-simul8?hsLang=en)
- [Process Mining](https://info.minitab.com/en/new-to-simul8?hsLang=en)
- [Key Capabilities](https://www.minitab.com/en-us/solutions/key-capabilities/)
- [Continuous Improvement](https://www.minitab.com/en-us/solutions/key-capabilities/continuous-improvement/)
- [Data Integration & Data Prep](https://www.minitab.com/en-us/solutions/key-capabilities/data-integration-data-prep/)
- [Diagramming & Mind Mapping](https://www.minitab.com/en-us/solutions/key-capabilities/diagramming-mind-mapping/)
- [Digital Twins](https://info.minitab.com/en/new-to-simul8?hsLang=en)
- [Model Deployment & ML Ops](https://www.minitab.com/en-us/solutions/key-capabilities/model-deployment-ml-ops/)
- [Innovation & Project Management](https://www.minitab.com/en-us/solutions/key-capabilities/innovation-project-management/)
- [Process Excellence: Detect, Correct & Prevent](https://www.minitab.com/en-us/solutions/key-capabilities/process-excellence/)
- [Featured Industries](https://www.minitab.com/en-us/solutions/industry/)
- [Academic](https://www.minitab.com/en-us/solutions/industry/academic/)
- [Energy & Natural Resources](https://www.minitab.com/en-us/solutions/industry/energy-resources/)
- [Government & Public Sector](https://www.minitab.com/en-us/solutions/industry/government/)
- [Healthcare](https://www.minitab.com/en-us/solutions/industry/healthcare/)
- [Insurance](https://www.minitab.com/en-us/solutions/industry/insurance/)
- [Manufacturing & Industrial](https://www.minitab.com/en-us/solutions/industry/manufacturing-industrial/)
- [Services](https://www.minitab.com/en-us/solutions/industry/service-industries/)
- [Software & Technology](https://www.minitab.com/en-us/solutions/industry/software-technology/)
- [Construction](https://www.minitab.com/en-us/solutions/industry/construction/)
- [Featured Roles](https://www.minitab.com/en-us/solutions/role/)
- [Engineering](https://www.minitab.com/en-us/solutions/role/engineering/)
- [Business Analysis](https://www.minitab.com/en-us/solutions/role/business-analysts/)
- [Information Technology](https://www.minitab.com/en-us/solutions/role/information-technology/)
- [Supply Chain](https://www.minitab.com/en-us/solutions/role/supply-chain/)
- [Customer Service & Contact Center](https://www.minitab.com/en-us/solutions/role/customer-service-contact-center/)
- [Human Resources](https://www.minitab.com/en-us/solutions/role/human-resources/)
- [Marketing](https://www.minitab.com/en-us/solutions/role/marketing/)
- [Research and Development](https://www.minitab.com/en-us/solutions/role/research-and-development/)
- Resources & Services
Back
[Resources & Services](https://www.minitab.com/en-us/resources-services/)
[All Resources & Services](https://www.minitab.com/en-us/resources-services/)
- [Resources](https://www.minitab.com/en-us/resources-services/resources/)
- [Case Studies](https://www.minitab.com/en-us/resources-services/resources/case-studies/)
- [eBooks & White Papers](https://www.minitab.com/en-us/resources-services/resources/ebooks-and-white-papers/)
- [Blog](https://blog.minitab.com/blog/?hsLang=en)
- [Data Sets](https://www.minitab.com/en-us/resources-services/resources/data-set/)
- [Webinars & Events](https://www.minitab.com/en-us/resources-services/resources/events/)
- [Education Hub](https://www.minitab.com/en-us/resources-services/resources/education-hub/)
- [Services](https://www.minitab.com/en-us/resources-services/services/)
- [Training](https://www.minitab.com/en-us/resources-services/services/training/)
- [Deployment](https://www.minitab.com/en-us/resources-services/services/deployment/)
- [Consulting](https://www.minitab.com/en-us/resources-services/services/statistical-consulting/)
- [Self-Paced Learning](https://www.minitab.com/en-us/resources-services/services/self-paced-learning/)
- [Continuing Education](https://www.minitab.com/en-us/resources-services/services/continuing-education/)
- Support
Back
[Support](https://www.minitab.com/en-us/support/)
[Technical Support](https://www.minitab.com/en-us/support/)
- [Subscriptions & Activation](https://www.minitab.com/en-us/support/subscriptions-and-activation/)
- [Minitab Quick Start](https://www.minitab.com/en-us/support/quick-start/)
- [Training](https://www.minitab.com/en-us/resources-services/services/training/)
- [Installation Support](https://www.minitab.com/en-us/support/installation/)
- [Support Videos](https://www.minitab.com/en-us/support/videos/)
- [Support Documentation](https://www.minitab.com/en-us/support/documents/)
- [Software Updates](https://www.minitab.com/en-us/support/software-updates/)
- [Product Downloads](https://www.minitab.com/en-us/support/downloads/)
- [Support Policy](https://www.minitab.com/en-us/support/policy/)
- Company
Back
[Company](https://www.minitab.com/en-us/company/)
[Company](https://www.minitab.com/en-us/company/)
- [About Us](https://www.minitab.com/en-us/company/our-company/)
- [Leadership Team](https://www.minitab.com/en-us/company/leadership-team/)
- [Partners](https://www.minitab.com/en-us/company/partners/)
- [Careers](https://www.minitab.com/en-us/company/careers/)
- [Contact](https://www.minitab.com/en-us/company/contact-us/)
- [News](https://www.minitab.com/en-us/company/press-releases/)
[Try/Buy](https://www.minitab.com/en-us/try-buy/)
- [Statistics](https://blog.minitab.com/en/blog/tag/statistics)
- [Data Analysis](https://blog.minitab.com/en/blog/tag/data-analysis)
-
- [Quality Improvement](https://blog.minitab.com/en/blog/tag/quality-improvement)
- [Subscribe](https://info.minitab.com/blog/subscribe?hsLang=en)

## Notice
You are now leaving minitab.com.
Click Continue to proceed to:
Continue
Go Back
# Understanding t-Tests: Why Degrees of Freedom Appeared in Minitab (and Why They Matter)
[Lauren Slovin](https://blog.minitab.com/en/blog/author/lauren-slovin) | 7/22/2026
Topics: [Data Analysis](https://blog.minitab.com/en/blog/tag/data-analysis), [Minitab Solution Center](https://blog.minitab.com/en/blog/tag/minitab-solution-center)
- [Share](https://www.linkedin.com/shareArticle?mini=true&url=https://blog.minitab.com/en/blog/understanding-t-tests-why-degrees-of-freedom-appeared-in-minitab-and-why-they-matter)
- [Share](https://www.facebook.com/sharer.php?u=https://blog.minitab.com/en/blog/understanding-t-tests-why-degrees-of-freedom-appeared-in-minitab-and-why-they-matter)
If you've recently run a [1-Sample t-Test](https://support.minitab.com/en-us/minitab/help-and-how-to/statistics/basic-statistics/how-to/1-sample-t/before-you-start/overview/) or [Paired t-Test](https://support.minitab.com/en-us/minitab/help-and-how-to/statistics/basic-statistics/how-to/paired-t/before-you-start/example/) in Minitab, you may have noticed something new in the output: [degrees of freedom (DF).](https://support.minitab.com/en-us/minitab/help-and-how-to/statistics/basic-statistics/supporting-topics/tests-of-means/what-are-degrees-of-freedom/)
It might seem like a small addition. The hypothesis test, p-value, and confidence interval are the same as before. Degrees of freedom have always been part of the calculation. Now, users no longer have to calculate DF manually. Displaying it makes Minitab's output more transparent and complete.
Let's take a closer look at what a t-test does and why this seemingly small change matters.
## **What is a t-test?**
A t-test is one of the most widely used statistical tools for comparing averages. It helps answer an important question: Is the difference I'm seeing real, or could it simply be due to random variation?
Imagine a manufacturer introduces a redesigned cutting tool and wants to know whether it lasts longer than the established standard of 1,120 cycles. The new design averages 1,165 cycles. A difference exists, but is it meaningful?
A t-test evaluates the difference while accounting for natural variability and sample size. It produces a p-value, which helps determine whether the result is statistically significant or could reasonably have occurred by chance. Whether you're comparing products, evaluating a process improvement, or measuring performance before and after a change, a t-test helps turn data into evidence.
### See how Minitab helps manufacturers improve quality, reduce waste, and strengthen performance. [](https://blog.minitab.com/hs/cta/wi/redirect?encryptedPayload=AVxigLIZbYHCFGI%2BYM6YwXXzPDP0FfQ6ReIgT3RuZNxRjvWDWxLVmdpvjfczRh5hPotR4xQ90JkesHGF9SKpvuWgY5IBb8aVarvRQcKyzgv9qYvwXSgL%2FfbiEOy5%2BV2BprbF0PUIdMJXB42ERWrTLVWy1%2FlN38kz800q0EonsAD8MEIR1msiVN8Nu1Hi&webInteractiveContentId=217726296169&portalId=3447555&hsLang=en)
## What is a confidence interval?
A p-value tells you whether a difference is statistically significant, and a [confidence interval](https://support.minitab.com/en-us/minitab/help-and-how-to/statistics/basic-statistics/supporting-topics/basics/what-is-a-confidence-interval/) tells you how large that difference might be.
Suppose your analysis estimates that a new process reduces production time by four minutes. Because you're working with a sample, there's uncertainty around that estimate. Minitab might report a 95% confidence interval of 2.9 to 5.1 minutes. This range represents plausible values for the true improvement. Narrow intervals indicate greater precision, while wider intervals reflect more uncertainty.
Confidence intervals complement hypothesis tests by providing practical context. Knowing that a difference exists is valuable; knowing approximately how large it is often matters even more.
## What are Degrees of Freedom?
Despite its technical name, DF describes the information available to estimate variation and draw reliable conclusions.
Imagine five customers have an average satisfaction score of 8 out of 10. If four scores are 7, 8, 9, and 8, the fifth must be 8 for the average to remain 8. Because one value is determined by the average, only four observations are free to vary. That leaves 5 − 1 = 4 degrees of freedom.
The same idea applies to a t-test. The software first estimates the sample average. Once that average is known, one degree of freedom is “used up,” leaving:
**1-Sample t-Test:** degrees of freedom = sample size − 1
**Paired t-Test:** degrees of freedom = number of pairs − 1
So, if you collect 20 observations, the degrees of freedom are 19.
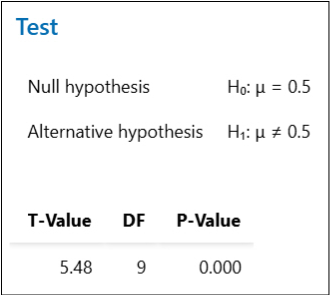
*Degrees of freedom now appear alongside the t-value and p-value in Minitab’s 1-Sample and Paired t-Test output.*
Think of degrees of freedom like a budget. Every observation gives you information, but estimating the sample average “spends” one piece of it. The remaining information helps the t-test estimate natural variation. More degrees of freedom generally allow greater precision.
With this update, you don't need to calculate this yourself. Minitab does it automatically.
## Why do Degrees of Freedom matter?
If you test only five tools, your results could be influenced by a few unusually good or bad performers. If you test 100 tools, you have much more evidence. The t-test accounts for this by using degrees of freedom to determine the p-value and confidence interval. With smaller samples, the test is more cautious because there's more uncertainty. As the sample size grows, the calculations become more precise.
The calculations haven't changed. Minitab has always used the appropriate degrees of freedom when calculating the t-statistic, p-value, and confidence interval. What's new is that DF is now displayed, making results easier to document, interpret, and verify.
## Why add Degrees of Freedom now, and who benefits?
Researchers include DF in publications, auditors use it to verify analyses, and instructors teach it alongside the t-statistic and p-value. Previously, Minitab users had to calculate DF manually or infer it from the sample size. Now it appears automatically, making results easier to report, validate, and reproduce.
For many day-to-day users, very little changes. If your primary goal is to determine whether a process improved or whether your product diameter is on target, the conclusions remain exactly the same. The added detail is especially useful for researchers, quality engineers in regulated industries, auditors, students, instructors, and statisticians who need to document or verify their analyses.
The math has not changed; the analysis is simply clearer. By displaying degrees of freedom in the standard output, Minitab removes an extra manual step and makes every 1-Sample and Paired t-Test easier to understand and support with confidence.
### Put clearer statistical analysis into practice with Minitab Solution Center. [](https://blog.minitab.com/hs/cta/wi/redirect?encryptedPayload=AVxigLJsPvNADuuYFeneFOYKaXl1GpUHlrlaLZ4jjcZW3kFot3EbQwf%2F2w6QQCPLL%2Bc46hFkk50FhcfdDxQj8RNRLbW4ZmLJg419iD5IJweAbZKGrIz24qTVPrNIIizC850OrcjVUqx0H%2BPH2el7I9BgywYEinaLFxokll3nYEZOKaOjoslyOMWQvU613EBv9fiP8AEMZNm9oUsT4Y9uJC%2B7bgNUWW9wbif9hU7HXD61&webInteractiveContentId=217730042663&portalId=3447555&hsLang=en)
## You Might Also Like
[Which World Cup Quarterfinal Teams Look Most Like Past Champions?](https://blog.minitab.com/en/blog/which-world-cup-quarterfinal-teams-look-most-like-past-champions?hsLang=en)
[Minitab Solution Center](https://blog.minitab.com/en/blog/tag/minitab-solution-center) | 6 Minute Read
[New Minitab Updates Unite Data Collection, Preparation, and Predictive Analytics](https://blog.minitab.com/en/blog/new-minitab-updates-unite-data-collection-preparation-and-predictive-analytics?hsLang=en)
[Data Preparation](https://blog.minitab.com/en/blog/tag/data-preparation) | 5 Minute Read
[Why Lean Six Sigma Adoption Doesn’t Stick](https://blog.minitab.com/en/blog/why-lean-six-sigma-adoption-doesnt-stick?hsLang=en)
[Minitab Solution Center](https://blog.minitab.com/en/blog/tag/minitab-solution-center) | 4 Minute Read
---
- [Careers](https://www.minitab.com/en-us/company/careers/)
- [Trust Center](https://www.minitab.com/en-us/trust-center/)
- [Suppliers](https://www.minitab.com/en-us/suppliers/)
- [Site Map](https://www.minitab.com/en-us/site-map/)
- [](https://www.linkedin.com/company/minitab/)
- [](https://www.facebook.com/Minitab/)
- [](https://www.youtube.com/user/MinitabInc)
- [](https://www.instagram.com/minitab/)
---
© 2025 Minitab, LLC. All Rights Reserved.
- [Terms of Use](https://www.minitab.com/en-us/legal/terms-of-use/)
- [Privacy Policy](https://www.minitab.com/en-us/legal/privacy-policy/)
- [Legal](https://www.minitab.com/en-us/legal/)
- Cookies Settings