As the self-proclaimed Statistical CFO, I am constantly trying to use statistics and simulation to drive better, data-driven decisions. When it comes to forecasting, various time series methods are a financial professional’s best friend – and I encourage you to use them. However, scenario analysis with Monte Carlo Simulation is a very practical use case for CFOs, particularly when it comes to forecasting near-term items like sales or earnings.
Here We Go Yo…Here We Go Yo: So What’s the Scenario for Using Monte Carlo
Imagine a CFO sitting with his sales team, getting pumped up by a Tribe Called Quest (see what I did there?), and getting forecasts for the upcoming quarter. Typically, the team will present a forecast that they believe is the best-guess, based on their knowledge and experience. They will likely provide upside opportunities and risks to the presented forecast.
What often differs a seasoned CFO from a less experienced one is how to “handicap” the forecasts of your sales team. One salesperson may be consistently conservative, so experience dictates that he is more than likely to meet or exceed his forecast. Another sales leader may be historically aggressive which requires a CFO to discount the forecast. This is all fine and good but incorporating a CFO’s personal view in the forecast is rife with problems, particularly recency bias.
Monte Carlo Simulation is the perfect tool to help take data provided and create a scenario analysis to support a forecast. It provides a sobering view of the forecast – eliminating the risks of both an overly optimistic leadership team or a pessimistic one.
See how this works in an engineering setting ⬇️

A Basic Finance Example: Regional or Divisional Forecasts
Imagine you have three regions and they each provide you with the following information:
Region 1: Projecting $10, with risks that could end up as $9 and upside of $12
Region 2: Projecting $20, with risks that could end up as $15 and upside of $22
Region 3: Projecting $17, with risks that could end up as $10 and upside of $27
Based on simple math, the combined forecast is $47, with the “worst case” scenario being $34 and the upside case of $61. Many CFOs will project the $47, while others will either risk-adjust it down and yet others may bake in some upside. So what would you project for the quarter?
Monte Carlo Simulation is Better Than Guessing
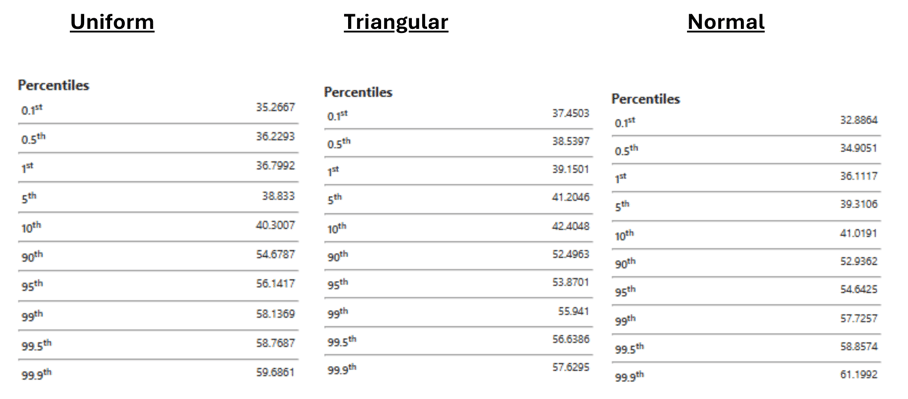
Running a Monte Carlo Simulation requires defining the distribution of the data, which either comes from historical data or process knowledge. In this case, I don’t have either, so I find it useful to run multiple simulations (using different distributions) to pressure test the results against each other. I ran three simulations: the first using a uniform distribution (which included the risks and upsides), the second using a triangular distribution (which included risks, forecast and upside) and the third using a normal distribution.
Want to see how the Statistical CFO tackles this analysis? Don’t miss our upcoming premiere and reserve your spot now.

Monte Carlo Simulation Provides Insight and Answers
When I look at the results below, I gain a real insight: all three of the simulations projected that 90% of the simulated outcomes are going to be less than or equal to $52 (or $55, for Uniform distribution). Equally importantly, only 10% of the runs will exceed those values.
From a risk perspective, only 10% of the outcomes are $41-$43, which represents a good “bear case” scenario.
Now, if I were a public company CFO, my guidance range would likely be something like $41 to $52, a much tighter band than the $34 to $61 range I was given. For those of us in the private sector, the simulation gives me a dose of reality about my upside, and more importantly puts a higher floor on my “worst case scenario” as in the simulations below, 10% of the time will I likely get results below $40. That means I can invest and run my business accordingly.
Conclusion: Take the Guesswork Out and Make Better Decisions
Keep in mind, in example above, there is a large range and only a few variables to guesstimate. The more complexity you add to your forecast equation (like adding costs as well!), the more utility Monte Carlo Simulation provides. Regardless, Monte Carlo Simulation provides insight – and guardrails – for your forecasting, either supporting or challenging your judgement with empirical evidence.
Ready to dive deeper? Enroll in our Monte Carlo Training Class today.