---
title: Which World Cup Quarterfinal Teams Look Most Like Past Champions?
description: Which World Cup quarterfinal teams have the data DNA of past champions? See how Minitab ranked the final eight.
image: https://blog.minitab.com/hubfs/WorldCup2026.jpg
---
English
- [English](https://blog.minitab.com/en/?hsLang=en)
- [Français](https://blog.minitab.com/fr/?hsLang=en)
- [Deutsch](https://blog.minitab.com/de/?hsLang=en)
- [Português](https://blog.minitab.com/pt/?hsLang=en)
- [Español](https://blog.minitab.com/es/?hsLang=en)
- [日本語](https://blog.minitab.com/ja/?hsLang=en)
- [한국어](https://blog.minitab.com/ko/?hsLang=en)
- [中文(简体)](https://blog.minitab.com/zh/?hsLang=en)
- [ Partners](https://www.minitab.com/en-us/company/partners/)
- [ Contact](https://www.minitab.com/en-us/company/contact-us/)
- [ Talk to Minitab](https://www.minitab.com/en-us/talk-to-minitab/)
- [ My Account](https://licensing.minitab.com/account/manage)
[](https://www.minitab.com/en-us/)
- Products
Back
[Products](https://www.minitab.com/en-us/products/)
[All Products](https://www.minitab.com/en-us/products/)
- [Minitab Solution Center](https://www.minitab.com/en-us/products/minitab-solution-center/)
- [Minitab Statistical Software](https://www.minitab.com/en-us/products/minitab/)
- [Minitab Connect](https://www.minitab.com/en-us/products/connect/)
- [Minitab Model Ops](https://www.minitab.com/en-us/products/model-ops/)
- [Minitab Education Hub](https://www.minitab.com/en-us/products/education-hub/)
- [Minitab Engage](https://www.minitab.com/en-us/products/engage/)
- [Minitab Workspace](https://www.minitab.com/en-us/products/workspace/)
- [Real-Time SPC](https://www.minitab.com/en-us/products/real-time-spc/)
- [Prolink Data Collection & SPC](https://www.minitab.com/en-us/products/prolink)
- [Simul8 Discrete Event Simulation](https://info.minitab.com/en/new-to-simul8?hsLang=en)
- [SPM](https://www.minitab.com/en-us/products/spm/)
- Solutions
Back
[Solutions](https://www.minitab.com/en-us/solutions/)
[All Solutions](https://www.minitab.com/en-us/solutions/)
- [Analytics](https://www.minitab.com/en-us/solutions/analytics/)
- [Statistics & Predictive Analytics](https://www.minitab.com/en-us/solutions/analytics/statistical-analysis-predictive-analytics/)
- [Data Science & Machine Learning](https://www.minitab.com/en-us/solutions/analytics/data-science-machine-learning/)
- [Business Analytics & Intelligence](https://www.minitab.com/en-us/solutions/analytics/business-analytics-intelligence/)
- [Statistical Process Control](https://www.minitab.com/en-us/solutions/analytics/statistical-process-control/)
- [Quality Analytics](https://www.minitab.com/en-us/solutions/analytics/quality-analytics/)
- [Live Analytics](https://www.minitab.com/en-us/solutions/analytics/live-analytics/)
- [Reliability & Life Data Analysis](https://www.minitab.com/en-us/solutions/analytics/reliability/)
- [Discrete Event Simulation](https://info.minitab.com/en/new-to-simul8?hsLang=en)
- [Process Mining](https://info.minitab.com/en/new-to-simul8?hsLang=en)
- [Key Capabilities](https://www.minitab.com/en-us/solutions/key-capabilities/)
- [Continuous Improvement](https://www.minitab.com/en-us/solutions/key-capabilities/continuous-improvement/)
- [Data Integration & Data Prep](https://www.minitab.com/en-us/solutions/key-capabilities/data-integration-data-prep/)
- [Diagramming & Mind Mapping](https://www.minitab.com/en-us/solutions/key-capabilities/diagramming-mind-mapping/)
- [Digital Twins](https://info.minitab.com/en/new-to-simul8?hsLang=en)
- [Model Deployment & ML Ops](https://www.minitab.com/en-us/solutions/key-capabilities/model-deployment-ml-ops/)
- [Innovation & Project Management](https://www.minitab.com/en-us/solutions/key-capabilities/innovation-project-management/)
- [Process Excellence: Detect, Correct & Prevent](https://www.minitab.com/en-us/solutions/key-capabilities/process-excellence/)
- [Featured Industries](https://www.minitab.com/en-us/solutions/industry/)
- [Academic](https://www.minitab.com/en-us/solutions/industry/academic/)
- [Energy & Natural Resources](https://www.minitab.com/en-us/solutions/industry/energy-resources/)
- [Government & Public Sector](https://www.minitab.com/en-us/solutions/industry/government/)
- [Healthcare](https://www.minitab.com/en-us/solutions/industry/healthcare/)
- [Insurance](https://www.minitab.com/en-us/solutions/industry/insurance/)
- [Manufacturing & Industrial](https://www.minitab.com/en-us/solutions/industry/manufacturing-industrial/)
- [Services](https://www.minitab.com/en-us/solutions/industry/service-industries/)
- [Software & Technology](https://www.minitab.com/en-us/solutions/industry/software-technology/)
- [Construction](https://www.minitab.com/en-us/solutions/industry/construction/)
- [Featured Roles](https://www.minitab.com/en-us/solutions/role/)
- [Engineering](https://www.minitab.com/en-us/solutions/role/engineering/)
- [Business Analysis](https://www.minitab.com/en-us/solutions/role/business-analysts/)
- [Information Technology](https://www.minitab.com/en-us/solutions/role/information-technology/)
- [Supply Chain](https://www.minitab.com/en-us/solutions/role/supply-chain/)
- [Customer Service & Contact Center](https://www.minitab.com/en-us/solutions/role/customer-service-contact-center/)
- [Human Resources](https://www.minitab.com/en-us/solutions/role/human-resources/)
- [Marketing](https://www.minitab.com/en-us/solutions/role/marketing/)
- [Research and Development](https://www.minitab.com/en-us/solutions/role/research-and-development/)
- Resources & Services
Back
[Resources & Services](https://www.minitab.com/en-us/resources-services/)
[All Resources & Services](https://www.minitab.com/en-us/resources-services/)
- [Resources](https://www.minitab.com/en-us/resources-services/resources/)
- [Case Studies](https://www.minitab.com/en-us/resources-services/resources/case-studies/)
- [eBooks & White Papers](https://www.minitab.com/en-us/resources-services/resources/ebooks-and-white-papers/)
- [Blog](https://blog.minitab.com/blog/?hsLang=en)
- [Data Sets](https://www.minitab.com/en-us/resources-services/resources/data-set/)
- [Webinars & Events](https://www.minitab.com/en-us/resources-services/resources/events/)
- [Education Hub](https://www.minitab.com/en-us/resources-services/resources/education-hub/)
- [Services](https://www.minitab.com/en-us/resources-services/services/)
- [Training](https://www.minitab.com/en-us/resources-services/services/training/)
- [Deployment](https://www.minitab.com/en-us/resources-services/services/deployment/)
- [Consulting](https://www.minitab.com/en-us/resources-services/services/statistical-consulting/)
- [Self-Paced Learning](https://www.minitab.com/en-us/resources-services/services/self-paced-learning/)
- [Continuing Education](https://www.minitab.com/en-us/resources-services/services/continuing-education/)
- Support
Back
[Support](https://www.minitab.com/en-us/support/)
[Technical Support](https://www.minitab.com/en-us/support/)
- [Subscriptions & Activation](https://www.minitab.com/en-us/support/subscriptions-and-activation/)
- [Minitab Quick Start](https://www.minitab.com/en-us/support/quick-start/)
- [Training](https://www.minitab.com/en-us/resources-services/services/training/)
- [Installation Support](https://www.minitab.com/en-us/support/installation/)
- [Support Videos](https://www.minitab.com/en-us/support/videos/)
- [Support Documentation](https://www.minitab.com/en-us/support/documents/)
- [Software Updates](https://www.minitab.com/en-us/support/software-updates/)
- [Product Downloads](https://www.minitab.com/en-us/support/downloads/)
- [Support Policy](https://www.minitab.com/en-us/support/policy/)
- Company
Back
[Company](https://www.minitab.com/en-us/company/)
[Company](https://www.minitab.com/en-us/company/)
- [About Us](https://www.minitab.com/en-us/company/our-company/)
- [Leadership Team](https://www.minitab.com/en-us/company/leadership-team/)
- [Partners](https://www.minitab.com/en-us/company/partners/)
- [Careers](https://www.minitab.com/en-us/company/careers/)
- [Contact](https://www.minitab.com/en-us/company/contact-us/)
- [News](https://www.minitab.com/en-us/company/press-releases/)
[Try/Buy](https://www.minitab.com/en-us/try-buy/)
- [Statistics](https://blog.minitab.com/en/blog/tag/statistics)
- [Data Analysis](https://blog.minitab.com/en/blog/tag/data-analysis)
-
- [Quality Improvement](https://blog.minitab.com/en/blog/tag/quality-improvement)
- [Subscribe](https://info.minitab.com/blog/subscribe?hsLang=en)

## Notice
You are now leaving minitab.com.
Click Continue to proceed to:
Continue
Go Back
# Which World Cup Quarterfinal Teams Look Most Like Past Champions?
[Oliver Franz](https://blog.minitab.com/en/blog/author/oliver-franz) | 7/8/2026
Topics: [Data Analysis](https://blog.minitab.com/en/blog/tag/data-analysis), [Minitab Solution Center](https://blog.minitab.com/en/blog/tag/minitab-solution-center)
- [Share](https://www.linkedin.com/shareArticle?mini=true&url=https://blog.minitab.com/en/blog/which-world-cup-quarterfinal-teams-look-most-like-past-champions)
- [Share](https://www.facebook.com/sharer.php?u=https://blog.minitab.com/en/blog/which-world-cup-quarterfinal-teams-look-most-like-past-champions)
Eight teams are left. Which one actually looks like a World Cup champion?
The field is smaller, the pressure is real, and every match carries the possibility of becoming part of a country’s history. There have been Cinderella teams, upsets, red cards, shootouts, and plenty of VAR reviews. Fans are watching from offices, homes, pubs, watch parties, and group chats, all asking some version of the same question: does my team look like a champion?
At [Minitab](http://minitab.com), we have been watching with bated breath too. But instead of starting with reputation, star power, or tradition, we wanted to look at the quarterfinals through data.
This is not a prediction of who will win the World Cup. Instead, we asked a different question:
**Which quarterfinal teams statistically look most like past World Cup champions?**
The eight teams left are Argentina, Belgium, England, France, Morocco, Norway, Spain, and Switzerland.
How does your team rank?
## What does a World Cup champion usually look like?
We started with every World Cup winner from 1994 through 2022 and looked at six team statistics:
- average possession
- shots per match
- shots on target per match
- goals per match
- goals allowed per match
- clean sheets
We used [Minitab Statistical Software](https://www.minitab.com/en-us/products/minitab/), located in [Minitab Solution Center](https://www.minitab.com/en-us/products/minitab-solution-center/), to analyze the data. Since 1994, the average World Cup champion has looked roughly like this:
**55% possession, 14.15 shots per match, 5.93 shots on target per match, 1.98 goals per match, 0.56 goals allowed per match, and 4.25 clean sheets.**
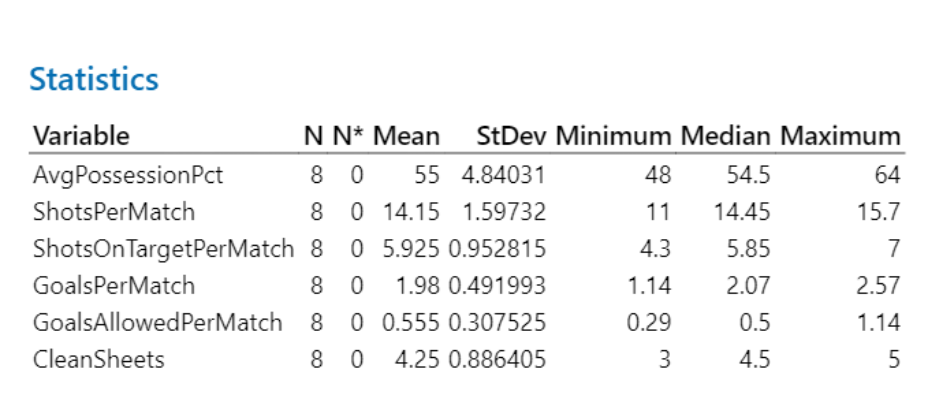
The pattern is not simply possession, and it is not centered only on scoring, but rather on balance. Recent champions have usually created steady attacking pressure while also controlling matches defensively.
## How we scored the quarterfinal teams
To create a Champion Fit Score to compare teams remaining in the tournament to past winners, we gave each team one point for matching each part of the historical champion profile:
- possession between 50% and 60%
- at least 13 shots per match
- at least 5.5 shots on target per match
- at least 1.8 goals per match
- 0.70 goals allowed per match or fewer
- clean sheets in at least 50% of matches
Each team could score from 0 to 6. The higher the score, the more closely that team resembles recent World Cup winners statistically.
### **Use Minitab Solution Center to build your own data-driven scorecard.** [](https://blog.minitab.com/hs/cta/wi/redirect?encryptedPayload=AVxigLLnWc9%2FfJ4lfzdzmBW3xmlOhsZmRbLX872vuDeYxtTdvyZPVeS9fuuYUy%2FLsax4%2B0VKz8drHYmNg6%2Bd%2FcnjuG%2BLflErOEveFaMkuEnpiK%2BNaViBmxMGxpFie%2B3Q0jcUOFpgrrB2MuAiG6%2FYm1p56ZhWaogUo7IoSnxpldUajTYNJl%2FoQeBXqVdvEcZzRC4RnGZFHMK8pSD%2FuHfhHOxiegQDBKjckcHH1%2FersJk1Hh0fVF%2F4EBcxuc%2FladJZuheZHg%3D%3D&webInteractiveContentId=216734747503&portalId=3447555&hsLang=en)
## Which quarterfinal teams look most like past winners?
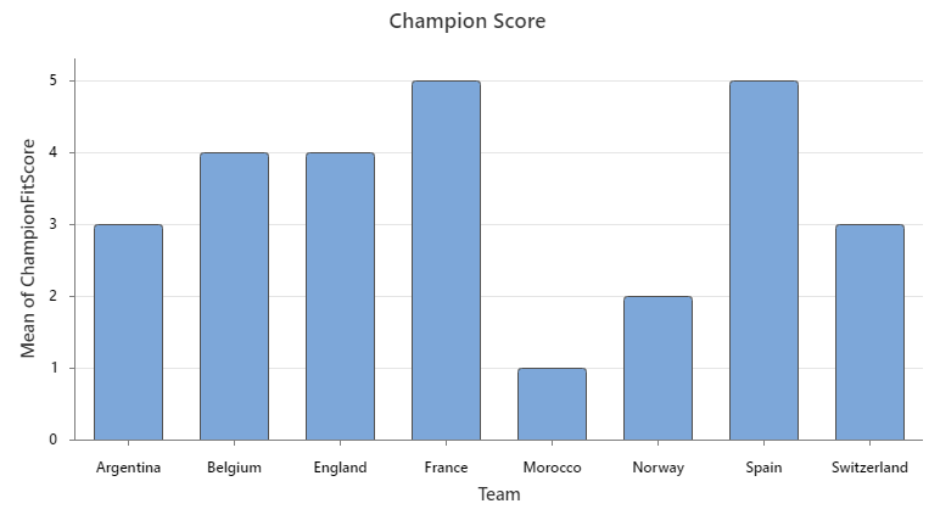
The clearest result is that France and Spain look the most like recent World Cup champions.
Both teams have a Champion Fit Score of 5, the highest among the quarterfinalists. France looks like the most complete profile, combining attacking pressure, scoring, shots on target, defensive control, and clean sheets. Spain reaches the same score in a different way, leaning more heavily on control and defense.
The next tier is Belgium and England, both with scores of 4. They match several champion traits and have enough attacking quality to beat anyone, but they do not fit the full historical profile quite as cleanly as France or Spain.
Argentina and Switzerland sit in the middle with scores of 3. Both are dangerous, but statistically they are less complete when compared with recent champions.
At the lower end, Norway scores 2 and Morocco scores 1.
Morocco and Norway can both still be dangerous in a knockout match, especially if they defend well, finish efficiently, or turn the games into tight, emotional contests. But by the Champion Fit Score, both Norway and Morocco sit outside the strongest champion-profile group.
## **A closer look at balance**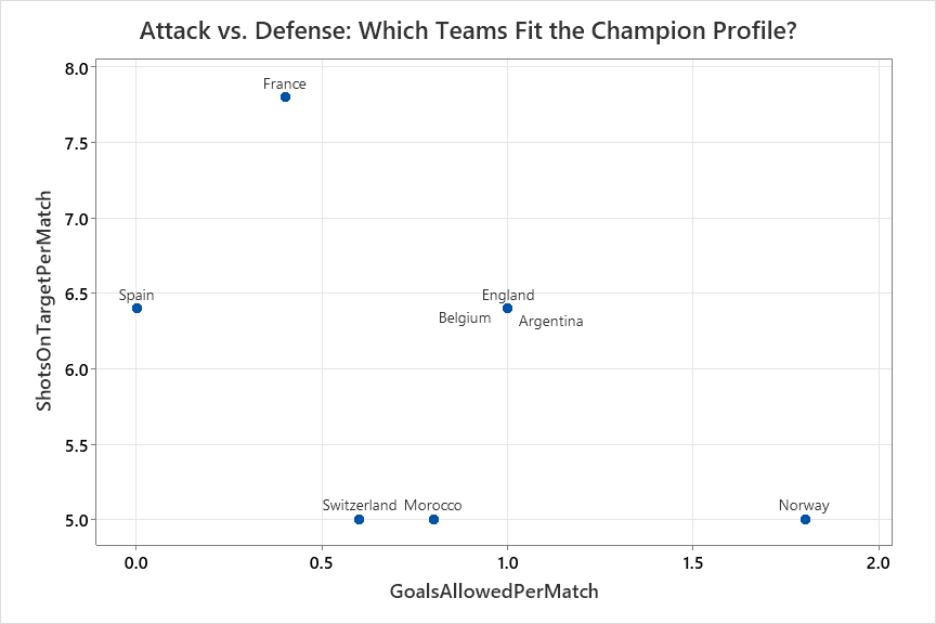
The Champion Fit Score points to France and Spain because both teams check many of the same statistical boxes as recent winners. But one reason that matters is that past champions have rarely been one-dimensional.
They have not only created chances. They have also limited opponents.
That is why we took one additional look at the quarterfinal teams through an attack-defense lens, comparing shots on target per match with goals allowed per match. Shots on target show how consistently a team is forcing opposing goalkeepers into action, while goals allowed shows how well that team is controlling risk at the other end.
The chart supports the Champion Fit Score results. France stands out because it combines the strongest attacking-danger number with a strong defensive profile. Spain also looks strong, especially defensively. Belgium, England, and Argentina create danger, but they have allowed more than the classic champion benchmark.
This chart is another way to see the same pattern: past champions tend to be balanced, dangerous going forward, and difficult to break down.
## The takeaway
The Champion Fit Score does not tell us who will win the World Cup, but it does tell us which quarterfinal teams most closely resemble recent winners.
Through the tournament so far, France and Spain look most like past World Cup champions, with Belgium and England forming the next tier.
But while the data gives us a lens, the players still have to decide the story on the field. May the best team win.
### **Do you have data you want to understand better?** [](https://blog.minitab.com/hs/cta/wi/redirect?encryptedPayload=AVxigLLb%2FQ88rHZmmmS3%2BGPdT45jgce%2F%2FmL%2F%2BqSqqLB9IeJ91iIM2YY2b3SdC%2BHkS%2FPXxAAStwY54UQVLVJFt1u9q4Ls9f%2FOpBwOmMANdVAYC5PQRIbK0CoDovyJfkgl3qrnD7edVidbR3EC7omXZXARSYaYUs1FdaTeQwOVjwB66iD2BlpkmTbO6x3jYwvcq7jIaHgUHUQCAARG7dwzBg7zH96eVCri&webInteractiveContentId=216738678712&portalId=3447555&hsLang=en)
## You Might Also Like
[Process Simulation Analysis Module: Analyze Data and Optimize Results](https://blog.minitab.com/en/blog/process-simulation-analysis-module?hsLang=en)
[Minitab Solution Center](https://blog.minitab.com/en/blog/tag/minitab-solution-center) | 3 Minute Read
[Scale Simulation Across Your Organization](https://blog.minitab.com/en/blog/scale-simulation-across-your-organization?hsLang=en)
[Minitab Solution Center](https://blog.minitab.com/en/blog/tag/minitab-solution-center) | 4 Minute Read
[Understanding t-Tests: Why Degrees of Freedom Appeared in Minitab (and Why They Matter)](https://blog.minitab.com/en/blog/understanding-t-tests-why-degrees-of-freedom-appeared-in-minitab-and-why-they-matter?hsLang=en)
[Minitab Solution Center](https://blog.minitab.com/en/blog/tag/minitab-solution-center) | 5 Minute Read
---
- [Careers](https://www.minitab.com/en-us/company/careers/)
- [Trust Center](https://www.minitab.com/en-us/trust-center/)
- [Suppliers](https://www.minitab.com/en-us/suppliers/)
- [Site Map](https://www.minitab.com/en-us/site-map/)
- [](https://www.linkedin.com/company/minitab/)
- [](https://www.facebook.com/Minitab/)
- [](https://www.youtube.com/user/MinitabInc)
- [](https://www.instagram.com/minitab/)
---
© 2025 Minitab, LLC. All Rights Reserved.
- [Terms of Use](https://www.minitab.com/en-us/legal/terms-of-use/)
- [Privacy Policy](https://www.minitab.com/en-us/legal/privacy-policy/)
- [Legal](https://www.minitab.com/en-us/legal/)
- Cookies Settings