---
title: "The Empirical CDF, Part 1: What's a CDF?"
description: "The Empirical CDF, Part 1: What's a CDF?"
image: https://blog.minitab.com/hubfs/B2BML%20-%20NEW%20FILE%20MANAGER%20STRUCTURE/Blog%20Images/Imported_Blog_Media/etchasketch-3.jpg
---
English
- [English](https://blog.minitab.com/en/?hsLang=en)
- [Français](https://blog.minitab.com/fr/?hsLang=en)
- [Deutsch](https://blog.minitab.com/de/?hsLang=en)
- [Português](https://blog.minitab.com/pt/?hsLang=en)
- [Español](https://blog.minitab.com/es/?hsLang=en)
- [日本語](https://blog.minitab.com/ja/?hsLang=en)
- [한국어](https://blog.minitab.com/ko/?hsLang=en)
- [中文(简体)](https://blog.minitab.com/zh/?hsLang=en)
- [ Partners](https://www.minitab.com/en-us/company/partners/)
- [ Contact](https://www.minitab.com/en-us/company/contact-us/)
- [ Talk to Minitab](https://www.minitab.com/en-us/talk-to-minitab/)
- [ My Account](https://licensing.minitab.com/account/manage)
[](https://www.minitab.com/en-us/)
- Products
Back
[Products](https://www.minitab.com/en-us/products/)
[All Products](https://www.minitab.com/en-us/products/)
- [Minitab Solution Center](https://www.minitab.com/en-us/products/minitab-solution-center/)
- [Minitab Statistical Software](https://www.minitab.com/en-us/products/minitab/)
- [Minitab Connect](https://www.minitab.com/en-us/products/connect/)
- [Minitab Model Ops](https://www.minitab.com/en-us/products/model-ops/)
- [Minitab Education Hub](https://www.minitab.com/en-us/products/education-hub/)
- [Minitab Engage](https://www.minitab.com/en-us/products/engage/)
- [Minitab Workspace](https://www.minitab.com/en-us/products/workspace/)
- [Real-Time SPC](https://www.minitab.com/en-us/products/real-time-spc/)
- [Prolink Data Collection & SPC](https://www.minitab.com/en-us/products/prolink)
- [Simul8 Discrete Event Simulation](https://info.minitab.com/en/new-to-simul8?hsLang=en)
- [SPM](https://www.minitab.com/en-us/products/spm/)
- Solutions
Back
[Solutions](https://www.minitab.com/en-us/solutions/)
[All Solutions](https://www.minitab.com/en-us/solutions/)
- [Analytics](https://www.minitab.com/en-us/solutions/analytics/)
- [Statistics & Predictive Analytics](https://www.minitab.com/en-us/solutions/analytics/statistical-analysis-predictive-analytics/)
- [Data Science & Machine Learning](https://www.minitab.com/en-us/solutions/analytics/data-science-machine-learning/)
- [Business Analytics & Intelligence](https://www.minitab.com/en-us/solutions/analytics/business-analytics-intelligence/)
- [Statistical Process Control](https://www.minitab.com/en-us/solutions/analytics/statistical-process-control/)
- [Quality Analytics](https://www.minitab.com/en-us/solutions/analytics/quality-analytics/)
- [Live Analytics](https://www.minitab.com/en-us/solutions/analytics/live-analytics/)
- [Reliability & Life Data Analysis](https://www.minitab.com/en-us/solutions/analytics/reliability/)
- [Discrete Event Simulation](https://info.minitab.com/en/new-to-simul8?hsLang=en)
- [Process Mining](https://info.minitab.com/en/new-to-simul8?hsLang=en)
- [Key Capabilities](https://www.minitab.com/en-us/solutions/key-capabilities/)
- [Continuous Improvement](https://www.minitab.com/en-us/solutions/key-capabilities/continuous-improvement/)
- [Data Integration & Data Prep](https://www.minitab.com/en-us/solutions/key-capabilities/data-integration-data-prep/)
- [Diagramming & Mind Mapping](https://www.minitab.com/en-us/solutions/key-capabilities/diagramming-mind-mapping/)
- [Digital Twins](https://info.minitab.com/en/new-to-simul8?hsLang=en)
- [Model Deployment & ML Ops](https://www.minitab.com/en-us/solutions/key-capabilities/model-deployment-ml-ops/)
- [Innovation & Project Management](https://www.minitab.com/en-us/solutions/key-capabilities/innovation-project-management/)
- [Process Excellence: Detect, Correct & Prevent](https://www.minitab.com/en-us/solutions/key-capabilities/process-excellence/)
- [Featured Industries](https://www.minitab.com/en-us/solutions/industry/)
- [Academic](https://www.minitab.com/en-us/solutions/industry/academic/)
- [Energy & Natural Resources](https://www.minitab.com/en-us/solutions/industry/energy-resources/)
- [Government & Public Sector](https://www.minitab.com/en-us/solutions/industry/government/)
- [Healthcare](https://www.minitab.com/en-us/solutions/industry/healthcare/)
- [Insurance](https://www.minitab.com/en-us/solutions/industry/insurance/)
- [Manufacturing & Industrial](https://www.minitab.com/en-us/solutions/industry/manufacturing-industrial/)
- [Services](https://www.minitab.com/en-us/solutions/industry/service-industries/)
- [Software & Technology](https://www.minitab.com/en-us/solutions/industry/software-technology/)
- [Construction](https://www.minitab.com/en-us/solutions/industry/construction/)
- [Featured Roles](https://www.minitab.com/en-us/solutions/role/)
- [Engineering](https://www.minitab.com/en-us/solutions/role/engineering/)
- [Business Analysis](https://www.minitab.com/en-us/solutions/role/business-analysts/)
- [Information Technology](https://www.minitab.com/en-us/solutions/role/information-technology/)
- [Supply Chain](https://www.minitab.com/en-us/solutions/role/supply-chain/)
- [Customer Service & Contact Center](https://www.minitab.com/en-us/solutions/role/customer-service-contact-center/)
- [Human Resources](https://www.minitab.com/en-us/solutions/role/human-resources/)
- [Marketing](https://www.minitab.com/en-us/solutions/role/marketing/)
- [Research and Development](https://www.minitab.com/en-us/solutions/role/research-and-development/)
- Resources & Services
Back
[Resources & Services](https://www.minitab.com/en-us/resources-services/)
[All Resources & Services](https://www.minitab.com/en-us/resources-services/)
- [Resources](https://www.minitab.com/en-us/resources-services/resources/)
- [Case Studies](https://www.minitab.com/en-us/resources-services/resources/case-studies/)
- [eBooks & White Papers](https://www.minitab.com/en-us/resources-services/resources/ebooks-and-white-papers/)
- [Blog](https://blog.minitab.com/blog/?hsLang=en)
- [Data Sets](https://www.minitab.com/en-us/resources-services/resources/data-set/)
- [Webinars & Events](https://www.minitab.com/en-us/resources-services/resources/events/)
- [Education Hub](https://www.minitab.com/en-us/resources-services/resources/education-hub/)
- [Services](https://www.minitab.com/en-us/resources-services/services/)
- [Training](https://www.minitab.com/en-us/resources-services/services/training/)
- [Deployment](https://www.minitab.com/en-us/resources-services/services/deployment/)
- [Consulting](https://www.minitab.com/en-us/resources-services/services/statistical-consulting/)
- [Self-Paced Learning](https://www.minitab.com/en-us/resources-services/services/self-paced-learning/)
- [Continuing Education](https://www.minitab.com/en-us/resources-services/services/continuing-education/)
- Support
Back
[Support](https://www.minitab.com/en-us/support/)
[Technical Support](https://www.minitab.com/en-us/support/)
- [Subscriptions & Activation](https://www.minitab.com/en-us/support/subscriptions-and-activation/)
- [Minitab Quick Start](https://www.minitab.com/en-us/support/quick-start/)
- [Training](https://www.minitab.com/en-us/resources-services/services/training/)
- [Installation Support](https://www.minitab.com/en-us/support/installation/)
- [Support Videos](https://www.minitab.com/en-us/support/videos/)
- [Support Documentation](https://www.minitab.com/en-us/support/documents/)
- [Software Updates](https://www.minitab.com/en-us/support/software-updates/)
- [Product Downloads](https://www.minitab.com/en-us/support/downloads/)
- [Support Policy](https://www.minitab.com/en-us/support/policy/)
- Company
Back
[Company](https://www.minitab.com/en-us/company/)
[Company](https://www.minitab.com/en-us/company/)
- [About Us](https://www.minitab.com/en-us/company/our-company/)
- [Leadership Team](https://www.minitab.com/en-us/company/leadership-team/)
- [Partners](https://www.minitab.com/en-us/company/partners/)
- [Careers](https://www.minitab.com/en-us/company/careers/)
- [Contact](https://www.minitab.com/en-us/company/contact-us/)
- [News](https://www.minitab.com/en-us/company/press-releases/)
[Try/Buy](https://www.minitab.com/en-us/try-buy/)
- [Statistics](https://blog.minitab.com/en/blog/tag/statistics)
- [Data Analysis](https://blog.minitab.com/en/blog/tag/data-analysis)
-
- [Quality Improvement](https://blog.minitab.com/en/blog/tag/quality-improvement)
- [Subscribe](https://info.minitab.com/blog/subscribe?hsLang=en)

## Notice
You are now leaving minitab.com.
Click Continue to proceed to:
Continue
Go Back
# The Empirical CDF, Part 1: What's a CDF?
Minitab Blog Editor | 1/25/2017
Topics: [Data Analysis](https://blog.minitab.com/en/blog/tag/data-analysis), [Statistics](https://blog.minitab.com/en/blog/tag/statistics)
- [Share](https://www.linkedin.com/shareArticle?mini=true&url=https://blog.minitab.com/en/blog/data-analysis-and-quality-improvement-and-stuff/the-empirical-cdf-part-1-whats-a-cumulative-distribution-function)
- [Share](https://www.facebook.com/sharer.php?u=https://blog.minitab.com/en/blog/data-analysis-and-quality-improvement-and-stuff/the-empirical-cdf-part-1-whats-a-cumulative-distribution-function)
T'was the season for toys recently, and Christmas day found me playing around with a classic, the Etch-a-Sketch. As I noodled with the knobs, I had a sudden flash of recognition: my drawing reminded me of the Empirical CDF Plot in [Minitab Statistical Software](http://www.minitab.com/en-us/products/minitab/). Did you just ask, "What's a CDF plot? And what's so empirical about it?" Both very good questions. Let's start with the first, and we'll save that second question for a future post.
The acronym CDF stands for Cumulative Distribution Function. If, like me, you're a big fan of failures, then you might be familiar with the cumulative failure plot that you can create with some Reliability/Survival tools in Minitab. (For an entertaining and offbeat example, check out this excellent post, [What I Learned from Treating Childbirth as a Failure](https://blog.minitab.com/blog/fun-with-statistics/what-i-learned-from-treating-childbirth-as-a-failure?hsLang=en).) The cumulative failure plot is a CDF.
Even if you're not a fan of failure plots and CDFs, you're likely very familiar with the CDF's famous cousin, the PDF or Probability Density Function. The classic "bell curve" is no more (and no less) than a PDF of a normal distribution.
For example, here's a histogram with a fitted normal PDF for [PinLength.MTW](http://support.minitab.com/en-us/datasets/capability-data-sets/connector-pin-lengths/), from Minitab's online Data Set Library.
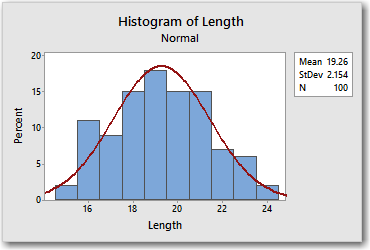
To create this plot, do the following:
1. Download the data file, [PinLength.MTW](http://support.minitab.com/en-us/datasets/capability-data-sets/connector-pin-lengths/), and open it in Minitab.
2. Choose **Graph > Histogram > With Fit**, and click **OK**.
3. In **Graph variables**, enter *Length*.
4. Click the **Scale** button.
5. On the **Y-Scale Type** tab, choose **Percent**.
6. Click **OK** in each dialog box.
The data are from a sample of 100 connector pins. The histogram and fitted line show that the lengths of the pins (shown on the x-axis) roughly follow a normal distribution with a mean of 19.26 and a standard deviation of 2.154. You can get the specifics for each bin of the histogram by hovering over the corresponding bar.
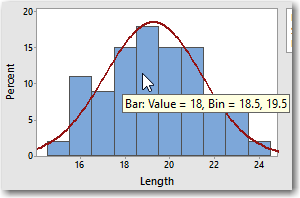
The height of each bar represents the percentage of observations in the sample that fall within the specified lengths. For example, the fifth bar is the tallest. Hovering over the fifth bar reveals that 18% of the bins have lengths that fall between 18.5 mm to 19.5 mm. Remember that for a moment.
Now let's try something a little different.
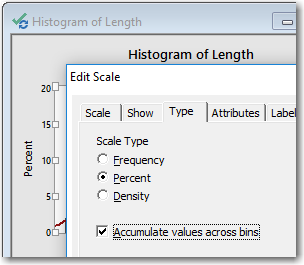
1. Double-click the y-axis.
2. On the **Type** tab, select **Accumulate values across bins**.
3. Click **OK**.
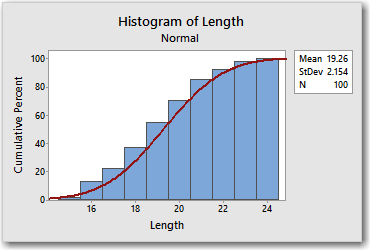
It looks very different, but it's the exact same data. The difference is that the bar heights now represent *cumulative* percentages. In other words, each bar represents the percentage of pins with the specified lengths *or smaller*.
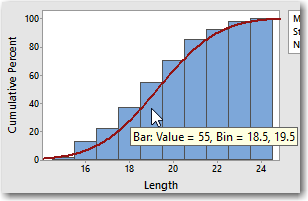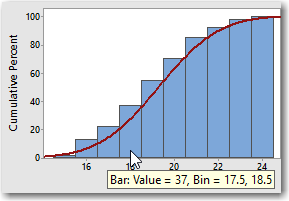
For example, the height of the fifth bar indicates that 55% of the pin lengths are less than 19.5 mm. The height of the fourth bar indicates that 37% of pin lengths are 18.5 or less. The difference in height between the 2 bars is 18, which tells us that 18% of the pins have lengths between 18.5 and 19.5. Which, if you remember, we already knew from our first graph. So the cumulative bars look different, but it's just another way of conveying the same information.
You may have also noticed that the fitted line no longer looks like a bell curve. That's because when we changed to a cumulative y-axis, Minitab changed the fitted line from a PDF to... you guessed it, a cumulative distribution function (CDF). Like the cumulative bars, the cumulative distribution function represents the cumulative percentage of observations that have values less than or equal to X. Basically, the CDF of a distribution gives us the [cumulative probabilities](https://blog.minitab.com/blog/understanding-statistics/difference-between-probability-and-cumulative-probability?hsLang=en) from the PDF of the same distribution.
I'll show you what I mean. Choose **Graph > Probability Distribution Plot > View Probability**, and click **OK**. Then enter the parameters and x-value as shown here, and click OK.
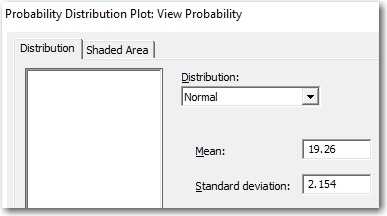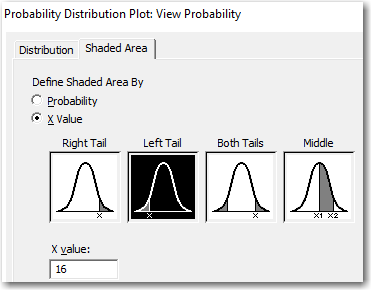
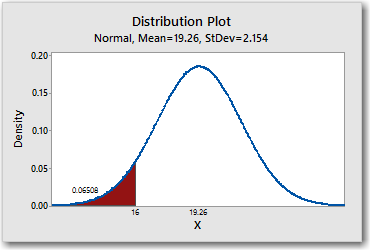
The "Left Tail" probabilities are cumulative probabilities. The plot tells us that the probability of obtaining a random value that is less than or equal to 16 is about 0.065. That's another way of saying that 6.5% of the values in this hypothetical population are less than or equal to 16.
Now we can create a CDF using the same parameters:
1. Choose **Graph > Empirical CDF > Single** and click **OK**.
2. In **Graph variables**, enter *Length*.
3. Click the **Distribution** button.
4. On the **Data Display** tab, select **Distribution fit only**.
5. Click **OK**, then click the **Scale** button.
6. On the **Percentile Lines tab**, under **Show percentile lines at data values**, enter *16*.
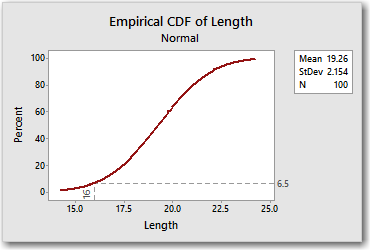
The CDF tells us that 6.5% of the values in this distribution are less than or equal to 16, as did the PDF.
Let's try another. Double-click the shaded area on the PDF and change x to 19.26, which is the mean of the distribution.
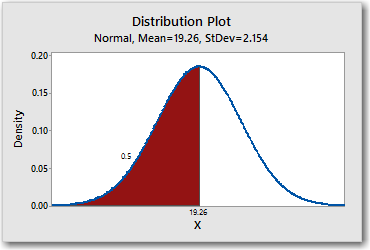
Naturally, because we're dealing with a perfect theoretical normal distribution here, half of the values in the hypothetical population are less than or equal to the mean. You can also visualize this on the CDF by adding another percentile line. Click the CDF and choose **Editor > Add > Percentile Lines**. Then enter 19.26 under **Show percentile lines at data values**.
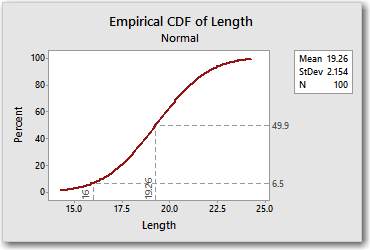
There's a little bit of rounding error, but the CDF tells us the same thing that we learned from the PDF, namely that 50% of the values in the distribution are less than or equal to the mean.
Finally, let's input a probability and determine the associated x-value. Double-click the shaded area on the PDF, but this time enter a probability of 0.95 as shown:
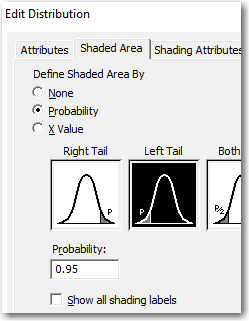
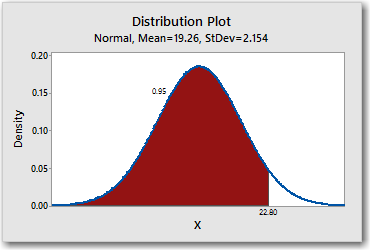
The PDF shows that the x-value that is associated with a cumulative probability of 0.5 is 22.80. Now right-click the CDF and choose **Add > Percentile Lines**. This time, under **Show percentile lines at Y values**, enter *95* for 95%.
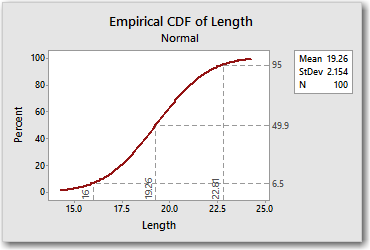
Once again, other than a little rounding error, the CDF tells us the same thing as the PDF.
For most people (maybe everyone?), the PDF is an easier way to visualize the shape of a distribution. But the nice thing about the CDF is that there's no need to look up probabilities for each x-value individually: all of the x-values in the distribution and the associated cumulative probabilities are right there on the curve.
## You Might Also Like
[Which World Cup Quarterfinal Teams Look Most Like Past Champions?](https://blog.minitab.com/en/blog/which-world-cup-quarterfinal-teams-look-most-like-past-champions?hsLang=en)
[Minitab Solution Center](https://blog.minitab.com/en/blog/tag/minitab-solution-center) | 6 Minute Read
[New Minitab Updates Unite Data Collection, Preparation, and Predictive Analytics](https://blog.minitab.com/en/blog/new-minitab-updates-unite-data-collection-preparation-and-predictive-analytics?hsLang=en)
[Data Preparation](https://blog.minitab.com/en/blog/tag/data-preparation) | 5 Minute Read
[Artemis II Heat Shield: How Do You Decide in Uncertain Conditions?](https://blog.minitab.com/en/blog/artemis-ii-heat-shield-how-do-you-decide-under-uncertainty?hsLang=en)
[Data Analysis](https://blog.minitab.com/en/blog/tag/data-analysis) | 4 Minute Read
---
- [Careers](https://www.minitab.com/en-us/company/careers/)
- [Trust Center](https://www.minitab.com/en-us/trust-center/)
- [Suppliers](https://www.minitab.com/en-us/suppliers/)
- [Site Map](https://www.minitab.com/en-us/site-map/)
- [](https://www.linkedin.com/company/minitab/)
- [](https://www.facebook.com/Minitab/)
- [](https://www.youtube.com/user/MinitabInc)
- [](https://www.instagram.com/minitab/)
---
© 2025 Minitab, LLC. All Rights Reserved.
- [Terms of Use](https://www.minitab.com/en-us/legal/terms-of-use/)
- [Privacy Policy](https://www.minitab.com/en-us/legal/privacy-policy/)
- [Legal](https://www.minitab.com/en-us/legal/)
- Cookies Settings