---
title: Exploring Healthcare Data, Part 2
description: Exploring Healthcare Data, Part 2
image: https://blog.minitab.com/hubfs/B2BML%20-%20NEW%20FILE%20MANAGER%20STRUCTURE/Blog%20Images/Imported_Blog_Media/washing_hands-3.jpg
---
English
- [English](https://blog.minitab.com/en/?hsLang=en)
- [Français](https://blog.minitab.com/fr/?hsLang=en)
- [Deutsch](https://blog.minitab.com/de/?hsLang=en)
- [Português](https://blog.minitab.com/pt/?hsLang=en)
- [Español](https://blog.minitab.com/es/?hsLang=en)
- [日本語](https://blog.minitab.com/ja/?hsLang=en)
- [한국어](https://blog.minitab.com/ko/?hsLang=en)
- [中文(简体)](https://blog.minitab.com/zh/?hsLang=en)
- [ Partners](https://www.minitab.com/en-us/company/partners/)
- [ Contact](https://www.minitab.com/en-us/company/contact-us/)
- [ Talk to Minitab](https://www.minitab.com/en-us/talk-to-minitab/)
- [ My Account](https://licensing.minitab.com/account/manage)
[](https://www.minitab.com/en-us/)
- Products
Back
[Products](https://www.minitab.com/en-us/products/)
[All Products](https://www.minitab.com/en-us/products/)
- [Minitab Solution Center](https://www.minitab.com/en-us/products/minitab-solution-center/)
- [Minitab Statistical Software](https://www.minitab.com/en-us/products/minitab/)
- [Minitab Connect](https://www.minitab.com/en-us/products/connect/)
- [Minitab Model Ops](https://www.minitab.com/en-us/products/model-ops/)
- [Minitab Education Hub](https://www.minitab.com/en-us/products/education-hub/)
- [Minitab Engage](https://www.minitab.com/en-us/products/engage/)
- [Minitab Workspace](https://www.minitab.com/en-us/products/workspace/)
- [Real-Time SPC](https://www.minitab.com/en-us/products/real-time-spc/)
- [Prolink Data Collection & SPC](https://www.minitab.com/en-us/products/prolink)
- [Simul8 Discrete Event Simulation](https://info.minitab.com/en/new-to-simul8?hsLang=en)
- [SPM](https://www.minitab.com/en-us/products/spm/)
- Solutions
Back
[Solutions](https://www.minitab.com/en-us/solutions/)
[All Solutions](https://www.minitab.com/en-us/solutions/)
- [Analytics](https://www.minitab.com/en-us/solutions/analytics/)
- [Statistics & Predictive Analytics](https://www.minitab.com/en-us/solutions/analytics/statistical-analysis-predictive-analytics/)
- [Data Science & Machine Learning](https://www.minitab.com/en-us/solutions/analytics/data-science-machine-learning/)
- [Business Analytics & Intelligence](https://www.minitab.com/en-us/solutions/analytics/business-analytics-intelligence/)
- [Statistical Process Control](https://www.minitab.com/en-us/solutions/analytics/statistical-process-control/)
- [Quality Analytics](https://www.minitab.com/en-us/solutions/analytics/quality-analytics/)
- [Live Analytics](https://www.minitab.com/en-us/solutions/analytics/live-analytics/)
- [Reliability & Life Data Analysis](https://www.minitab.com/en-us/solutions/analytics/reliability/)
- [Discrete Event Simulation](https://info.minitab.com/en/new-to-simul8?hsLang=en)
- [Process Mining](https://info.minitab.com/en/new-to-simul8?hsLang=en)
- [Key Capabilities](https://www.minitab.com/en-us/solutions/key-capabilities/)
- [Continuous Improvement](https://www.minitab.com/en-us/solutions/key-capabilities/continuous-improvement/)
- [Data Integration & Data Prep](https://www.minitab.com/en-us/solutions/key-capabilities/data-integration-data-prep/)
- [Diagramming & Mind Mapping](https://www.minitab.com/en-us/solutions/key-capabilities/diagramming-mind-mapping/)
- [Digital Twins](https://info.minitab.com/en/new-to-simul8?hsLang=en)
- [Model Deployment & ML Ops](https://www.minitab.com/en-us/solutions/key-capabilities/model-deployment-ml-ops/)
- [Innovation & Project Management](https://www.minitab.com/en-us/solutions/key-capabilities/innovation-project-management/)
- [Process Excellence: Detect, Correct & Prevent](https://www.minitab.com/en-us/solutions/key-capabilities/process-excellence/)
- [Featured Industries](https://www.minitab.com/en-us/solutions/industry/)
- [Academic](https://www.minitab.com/en-us/solutions/industry/academic/)
- [Energy & Natural Resources](https://www.minitab.com/en-us/solutions/industry/energy-resources/)
- [Government & Public Sector](https://www.minitab.com/en-us/solutions/industry/government/)
- [Healthcare](https://www.minitab.com/en-us/solutions/industry/healthcare/)
- [Insurance](https://www.minitab.com/en-us/solutions/industry/insurance/)
- [Manufacturing & Industrial](https://www.minitab.com/en-us/solutions/industry/manufacturing-industrial/)
- [Services](https://www.minitab.com/en-us/solutions/industry/service-industries/)
- [Software & Technology](https://www.minitab.com/en-us/solutions/industry/software-technology/)
- [Construction](https://www.minitab.com/en-us/solutions/industry/construction/)
- [Featured Roles](https://www.minitab.com/en-us/solutions/role/)
- [Engineering](https://www.minitab.com/en-us/solutions/role/engineering/)
- [Business Analysis](https://www.minitab.com/en-us/solutions/role/business-analysts/)
- [Information Technology](https://www.minitab.com/en-us/solutions/role/information-technology/)
- [Supply Chain](https://www.minitab.com/en-us/solutions/role/supply-chain/)
- [Customer Service & Contact Center](https://www.minitab.com/en-us/solutions/role/customer-service-contact-center/)
- [Human Resources](https://www.minitab.com/en-us/solutions/role/human-resources/)
- [Marketing](https://www.minitab.com/en-us/solutions/role/marketing/)
- [Research and Development](https://www.minitab.com/en-us/solutions/role/research-and-development/)
- Resources & Services
Back
[Resources & Services](https://www.minitab.com/en-us/resources-services/)
[All Resources & Services](https://www.minitab.com/en-us/resources-services/)
- [Resources](https://www.minitab.com/en-us/resources-services/resources/)
- [Case Studies](https://www.minitab.com/en-us/resources-services/resources/case-studies/)
- [eBooks & White Papers](https://www.minitab.com/en-us/resources-services/resources/ebooks-and-white-papers/)
- [Blog](https://blog.minitab.com/blog/?hsLang=en)
- [Data Sets](https://www.minitab.com/en-us/resources-services/resources/data-set/)
- [Webinars & Events](https://www.minitab.com/en-us/resources-services/resources/events/)
- [Education Hub](https://www.minitab.com/en-us/resources-services/resources/education-hub/)
- [Services](https://www.minitab.com/en-us/resources-services/services/)
- [Training](https://www.minitab.com/en-us/resources-services/services/training/)
- [Deployment](https://www.minitab.com/en-us/resources-services/services/deployment/)
- [Consulting](https://www.minitab.com/en-us/resources-services/services/statistical-consulting/)
- [Self-Paced Learning](https://www.minitab.com/en-us/resources-services/services/self-paced-learning/)
- [Continuing Education](https://www.minitab.com/en-us/resources-services/services/continuing-education/)
- Support
Back
[Support](https://www.minitab.com/en-us/support/)
[Technical Support](https://www.minitab.com/en-us/support/)
- [Subscriptions & Activation](https://www.minitab.com/en-us/support/subscriptions-and-activation/)
- [Minitab Quick Start](https://www.minitab.com/en-us/support/quick-start/)
- [Training](https://www.minitab.com/en-us/resources-services/services/training/)
- [Installation Support](https://www.minitab.com/en-us/support/installation/)
- [Support Videos](https://www.minitab.com/en-us/support/videos/)
- [Support Documentation](https://www.minitab.com/en-us/support/documents/)
- [Software Updates](https://www.minitab.com/en-us/support/software-updates/)
- [Product Downloads](https://www.minitab.com/en-us/support/downloads/)
- [Support Policy](https://www.minitab.com/en-us/support/policy/)
- Company
Back
[Company](https://www.minitab.com/en-us/company/)
[Company](https://www.minitab.com/en-us/company/)
- [About Us](https://www.minitab.com/en-us/company/our-company/)
- [Leadership Team](https://www.minitab.com/en-us/company/leadership-team/)
- [Partners](https://www.minitab.com/en-us/company/partners/)
- [Careers](https://www.minitab.com/en-us/company/careers/)
- [Contact](https://www.minitab.com/en-us/company/contact-us/)
- [News](https://www.minitab.com/en-us/company/press-releases/)
[Try/Buy](https://www.minitab.com/en-us/try-buy/)
- [Statistics](https://blog.minitab.com/en/blog/tag/statistics)
- [Data Analysis](https://blog.minitab.com/en/blog/tag/data-analysis)
-
- [Quality Improvement](https://blog.minitab.com/en/blog/tag/quality-improvement)
- [Subscribe](https://info.minitab.com/blog/subscribe?hsLang=en)

## Notice
You are now leaving minitab.com.
Click Continue to proceed to:
Continue
Go Back
# Exploring Healthcare Data, Part 2
Minitab Guest Blogger | 5/3/2016
Topics: [Healthcare](https://blog.minitab.com/en/blog/tag/healthcare)
- [Share](https://www.linkedin.com/shareArticle?mini=true&url=https://blog.minitab.com/en/blog/meredith-griffith/exploring-healthcare-data-part-2)
- [Share](https://www.facebook.com/sharer.php?u=https://blog.minitab.com/en/blog/meredith-griffith/exploring-healthcare-data-part-2)
In the [first part](https://blog.minitab.com/blog/meredith-griffith/exploring-healthcare-data-part-1?hsLang=en) of this series, we looked at a case study where staff at a hospital used ATP swab tests to test 8 surfaces for bacteria in 10 different hospital rooms across 5 departments. ATP measurements below 400 units pass the swab test, while measurements greater than or equal to 400 units fail the swab test and require further investigation.
I offered two tips on exploring and visualizing data using graphs, brushing, and conditional formatting.
1. **Evaluate the shape of your data.**
2. **Identify and investigate outliers.**
By performing these preliminary explorations on the swab test data, we discovered that the mean ATP measurement would not be effective for testing whether surfaces showed statistically significant differences in contamination levels. This was due to the data being highly skewed by extreme outliers.
We then identified where these unusually high-ATP measurements were discovered in the hospital. These findings provide valuable information for appropriately focusing process improvement efforts on particular hospital rooms, departments, and surfaces within those rooms.
Now that we've seen how much some simple exploration and visualization tools can reveal, let's run through three more tools that will help you explore your own healthcare data in order to draw actionable insights.
If you’d like to follow along and didn't already download the data from the first post, you can [download and explore the data](http://cdn.app.compendium.com/uploads/user/458939f4-fe08-4dbc-b271-efca0f5a2682/479b4fbd-f8c0-4011-9409-f4109cc4c745/Image/b7c8abc2ba12bed0e1aa6e69d8e22d06/atp.MPJ) yourself! If you don’t yet have Minitab 17, you can download the [free, 30-day trial](http://www.minitab.com/products/minitab/free-trial/).
## Tip #3: Manipulate the data
The swab test data the hospital staff collected and recorded is unstacked—this simply means that all response measurements are contained in multiple columns rather than stacked together in one column. To do additional data visualization and a more formal analysis, you need to reconfigure or manipulate how the data is arranged. We can accomplish this by stacking rows.
The **ATP Stacked.MTW** worksheet in the downloadable Minitab project file above already has the data reshaped for you. But you can manipulate the data on your own using the **ATP Unstacked.MTW** worksheet. Just navigate to **Data > Stack > Rows**, and complete the dialog as shown:
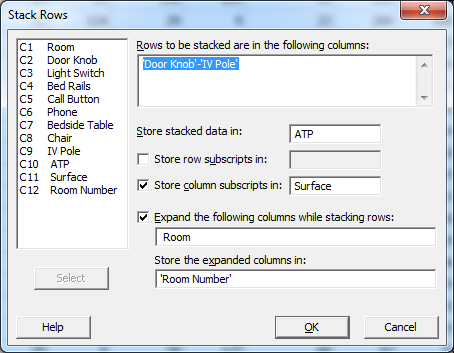
Stacking all rows of your data and storing the associated column subscripts (or column names) in a separate column will result in all ATP measurements stacked into one column, a separate column containing categories for Surfaces, and another column containing the Room Number.
With stacked data, you are properly set up to perform formal analyses in Minitab—this is an important step as you work with your data, as most Minitab analyses require columns of stacked data. We won’t tackle a formal analysis here, but rest assured that you are set up to do so!
## Tip #4: Extract information from your original data set
Once your data are stacked, you can use functions available in **Calc > Calculator** and **Data > Recode** to leverage information intrinsic to your original data to create new variables to explore and analyze.
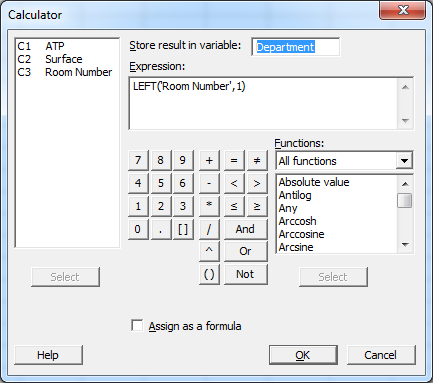
For instance, we know the first character of each room number denotes the department. You can use the ‘left’ function in **Calc > Calculator** to extract the left-most character from the Room column, and store the result in a new column labeled Department. You can do this by filling out the **Calculator** dialog as shown:
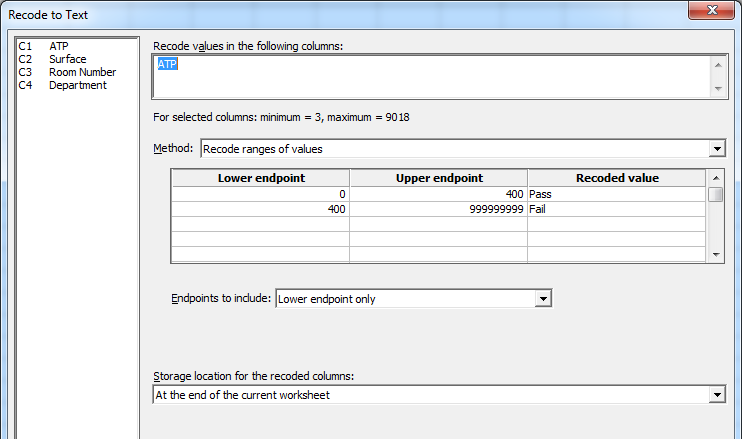
You also know that ATP measurements below 400 ‘pass’ the ATP swab test. Recoding ranges of ATP values to text to indicate which values ‘Pass’ and which values ‘Fail’ can be useful when visualizing the data. You can do this by filling out the **Data >** **Recode > To Text** dialog as shown:
Finally, you can use this newly extracted data to create a stacked bar chart showing the counts of measurements that failed, passed, or were missing from the ATP swab test across Department and the recoded ATP. Using the **ATP Stacked.MTW** worksheet, navigate to **Graph > Bar Chart > Stack**. Verify that the **Bars represent** drop-down shows the default selection, *Counts of unique values*. Click **OK.** Select Department and Recoded ATP as Categorical variables, and click **OK.**
Minitab produces the following graph:
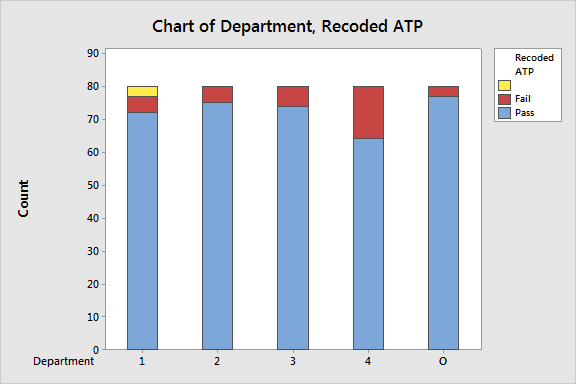
The bar chart reveals that:
- Department 4 has the highest count of ATP measurements that failed the swab test.
- The sanitation team should consider focusing initial efforts in department 4 as the investigation of problems with room-cleaning procedures continues.
## Tip #5: Obtain important statistics that describe your data
Now that we’ve manipulated the data in a way that prepares us for more formal analyses, identified which department contains the most contaminated surfaces, and compared the portion of measurements in each department that passed or failed the ATP swab test, we can display descriptive statistics to get an idea of how mean or median bacteria levels differed or varied across surfaces and across departments.
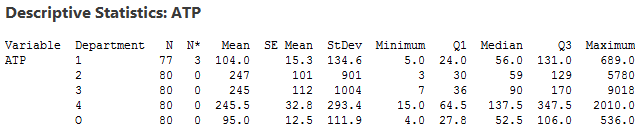
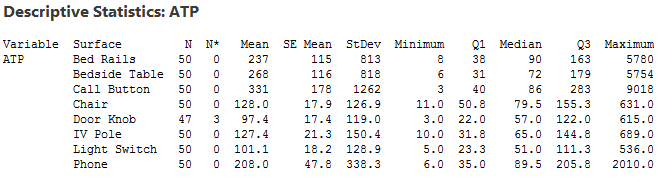
Using the **ATP Stacked.MTW** worksheet, navigate to **Stat > Basic Statistics > Display Descriptive Statistics**. Enter ATP as the **Variable,** Department as the **By variable,** and click **OK.** Press Ctrl + E to re-enter the **Display Descriptive Statistics** dialog, and replace Department with Surface as the **By variable**. Click **OK. ** The following output displays in Minitab’s Session Window.
The descriptive statistics reveal helpful information:
- These statistics allow for easy comparison of mean and median ATP measurements as well as the variation of ATP measurements, either by department or by surface.
- Notice that mean ATP measurements are much higher than median ATP measurements for both sets of descriptive statistics. This is because the data are right-skewed. Certain analyses that assume you have normally distributed data—such as t-tests to compare means—might not be the best tool to formally analyze this data. Comparing medians might offer more insight.
- Both sets of descriptive statistics highlight which departments and surfaces to focus on for investigation and process improvement efforts. For instance, department 4 has the highest median ATP presence, while Bed Rails, Phone, and Call Button—the touch points closest to a sick patient in a hospital bed—appear to be the most problematic surfaces to sanitize. Process improvement efforts can begin with this information.
## What Else Can You Do with Your Data?
What you’ve seen in this two-part blog post is just the beginning. But consider how much of this initial exploration is *actionable!* By having this foundation for visualizing and manipulating your data, you’ll be well on your way to investigating and testing root causes, and more efficiently performing analyses that yield trustworthy results.
If you’re interested in how other healthcare organizations use Minitab for quality improvement, check out our [case studies](http://www.minitab.com/en-us/company/case-studies/?Industry=healthcare&Product=mss).
## You Might Also Like
[Inside the 2025 IHI Forum: What Healthcare Leaders Are Saying About AI](https://blog.minitab.com/en/blog/ihi-forum-healthcare-and-ai?hsLang=en)
[Minitab Ai](https://blog.minitab.com/en/blog/tag/minitab-ai) | 5 Minute Read
[Five Approaches to Enhance Patient Safety](https://blog.minitab.com/en/blog/five-approaches-to-enhance-patient-safety?hsLang=en)
[Operations](https://blog.minitab.com/en/blog/tag/operations) | 5 Minute Read
[Navigating Healthcare Challenges for the 3 Ps + 1](https://blog.minitab.com/en/blog/3ps-healthcare-challenges?hsLang=en)
[Minitab](https://blog.minitab.com/en/blog/tag/minitab) | 5 Minute Read
---
- [Careers](https://www.minitab.com/en-us/company/careers/)
- [Trust Center](https://www.minitab.com/en-us/trust-center/)
- [Suppliers](https://www.minitab.com/en-us/suppliers/)
- [Site Map](https://www.minitab.com/en-us/site-map/)
- [](https://www.linkedin.com/company/minitab/)
- [](https://www.facebook.com/Minitab/)
- [](https://www.youtube.com/user/MinitabInc)
- [](https://www.instagram.com/minitab/)
---
© 2025 Minitab, LLC. All Rights Reserved.
- [Terms of Use](https://www.minitab.com/en-us/legal/terms-of-use/)
- [Privacy Policy](https://www.minitab.com/en-us/legal/privacy-policy/)
- [Legal](https://www.minitab.com/en-us/legal/)
- Cookies Settings