I've never understood the fascination with selfies.
Maybe it's because I'm over 50. After surviving the slings and arrows of a half a century on Earth, the minute or two I spend in front of the bathroom mirror each morning is more than enough selfie time for me.
Still, when I heard that Microsoft had an online app that estimates the age of any face on a photo, I was intrigued.
How would the app quantify the cracks, fissures, and crevices of my 56-year-old mug?
The Pre-Experiment Phase, aka PlayTime
At first, I just goofed around with the app, taking some selfies with my iPad and observing the estimates.
It didn’t take long to notice some whopping variability in the estimates. Variability that made me alternately smile or weep:
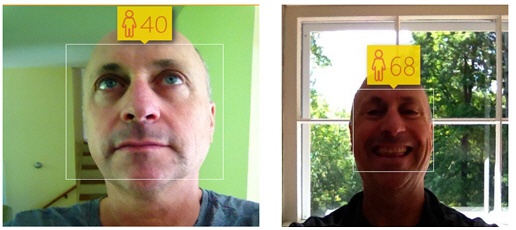
But I soon tired of my subjective responses to the age estimates. They just caused my face to scrunch up and accelerate the aging process, anyway.
It was time to take a step back and approach the problem more objectively.
If the How Old Do I Look app were a process, and its age estimates its “product,” what factors might affect its variability?
And, by identifying the optimal settings for these factors, could I uncover a strategy (sans plastic surgery) for taking the most age-defying selfie possible?
Creating a Full Factorial Design
After informally experimenting with selfies taken with an iPad, I came up with 5 factors that might affect the age estimates produced by the app.
- Light source: Indicates whether main light source was in front of me or behind me
- Angle: Indicates whether the iPad was held straight in front to me (0°), above my face (+45°), or below my face (-45°)
- Smile: Indicates whether I smiled, frowned, or stared blankly like a zombie
- Distance: Indicates how far the iPad was held from my face (0.5, 1, or 2 ft)
- Shave: Indicates whether I had shaved before the photo was taken
Using Minitab (Stat > DOE> Factorial > Create Factorial Design), I created a general full factorial design with these 5 factors, entering the levels for each factor as shown below:
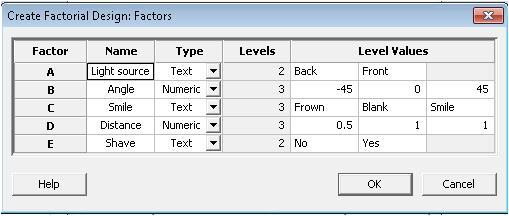
Using that information, Minitab created a randomized worksheet that detailed the factor settings I should use to take each selfie for the experiment. I added the Age column to record the age estimate given by the app.

So, for the first selfie (row 1), I needed to take the photo with the light source in back of me, with the iPad below my face pointing upward (-45), at a distance of 1 foot, when I was smiling and unshaven.
The full factorial design required 108 runs—that is, 108 selfies. Brutal, yes. But a necessary sacrifice for the advancement of selfie science.
Note: I used a full factorial design because collecting data for this experiment was quick, easy, and free. If collecting data for an experiment requires a significant amount of time and money, and you have limited resources, you might opt instead for a fractional factorial design.
Evaluating the Main Effects
When you analyze a DOE experiment, you can display a main effects plot to examine differences among the means across the factor levels. For this experiment, the plot shows the differences in the mean age estimate at each "setting" used to take the selfie.
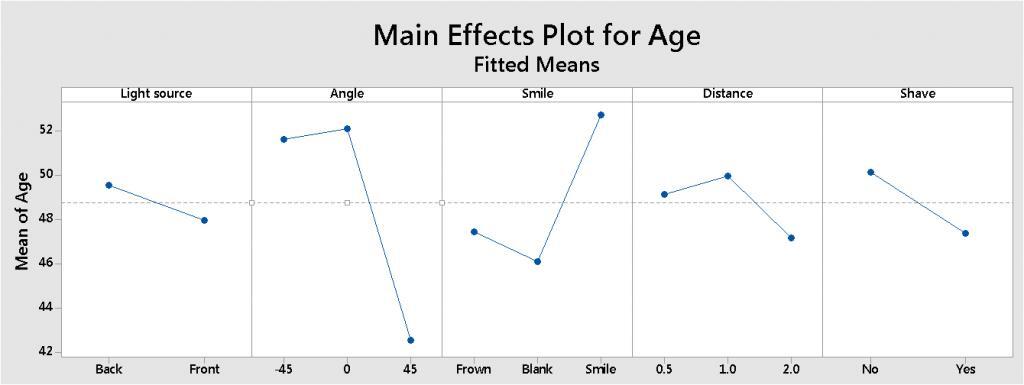
To get the lowest age estimate from the app, the selfie should be taken with the light source in front of me, from above my face (45 degrees), at a distance of 2 feet, when I was clean-shaven, and had a blank, zombie-like expression on my face. The mean age estimate was highest when I smiled.
But before I make a pointed effort to mimic the expression of the walking dead, or ask everyone stand at least 2 feet away from me, there are a couple other things that are important to consider.
- Are any of these main effects statistically significant?
- Are there significant interactions between the factors that could make these main effects misleading?
Determining the Final Model
For this experiment, I limited the analysis to main effects and two-way interactions between factors. Using step-wise selection, and a significance level of 0.15, Minitab determined the following final model:
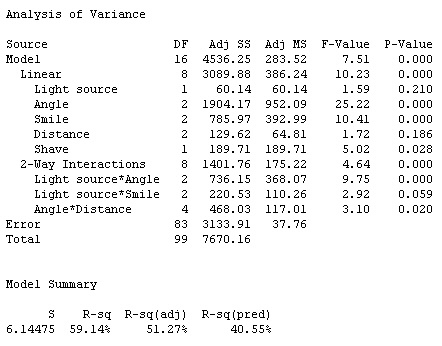
Of the main effects, only Angle, Smile, and Shave are statistically significant (P-value < 0.15). Distance (P-value = 0.186) and Light source (P-value = 0.210) are not statistically significant. However, both of these factors are part of at least one significant 2-way interaction, so they're included in the final model.
The adjusted R-squared value (51.27%) shows that these factors and their interactions explain over 50% of the variation in the app's age estimates of the selfies!
Evaluating the Interactions
To clearly see how these significant 2-way interactions affect the response, I displayed an interaction plot.
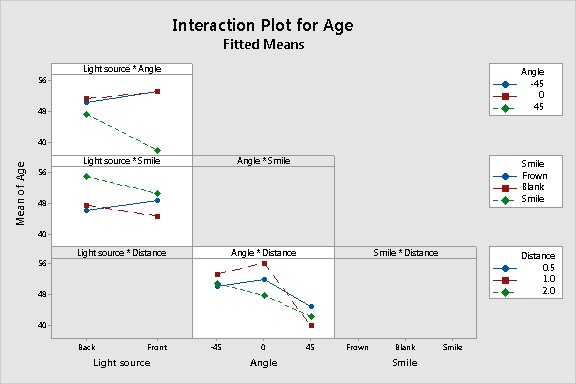
When you eyeball the interaction plot, look for lines that aren't parallel. They indicate interactions.
For example, consider the the Light source*Angle plot in the upper left. It shows that when the selfie is taken straight-on (0 degrees) or from below (-45), a light source from the front results in a slightly higher mean age estimate. However, when the selfie is taken from above (+45), the effect of the light source is reversed--having the light source in front significantly reduces the mean age estimate. That puts a whole new spin on the original interpretation of the light source as a main effect.
Concluding Comments
I don't know what algorithms the "How Old Do I Look" app uses to make its age estimates. But by analyzing a designed experiment of selfies taken with an iPad, I identified some factors and interactions that are significantly associated with the variability of the age estimates.
As for the selfie craze itself…I remain as baffled as ever. A lot of new research is being done to delve deeper into the phenomenon. For example, one recent study found that men who post a lot of selfies online score higher on measures of anti-social psychopathy.
After taking 108 selfies for this experiment and posting the results online, I'm feeling very relieved about one thing: Correlation does *not* equal causation.


