Last time, we talked about center points and replicates in design of experiments. It turns out that both are tools that you can use to increase the probability of finding a statistically significant difference. But what we really want to know is, how many center points and replicates should be in the gummi bear experiment? To answer that question, we have to estimate the standard deviation of the distances the gummi bears go.
Estimating the Standard Deviation When You Do Design of Experiments
I do have an old data set from some students launching gummi bears that I can use. Historical data is a typical way to help with design of experiments.
Distance (inches)
32
41.5
19
32.5
6
47.5
35
35.5
41
30
29
29.5
31
32
34
31.5
33.5
40
39
21.5
Of course, historical data isn’t perfect. The histogram shows that there’s one extremely low value (6 inches). We’ll look at how that outlier affects the analysis, then make a decision about how to treat the data. To estimate the standard deviation, I’ll copy the above data into a column in Minitab, then:
1. Choose Stat > Basic Statistics > Display Descriptive Statistics
2. Highlight the column of data and click Select
3. Click Statistics. Choose None, then check Standard Deviation. Click OK in both dialog boxes.
I included a column without the 6 inch distance, so I got this:

To look at the power for a factorial design in Minitab:
1. Choose Stat > Power and Sample Size > 2-Level Factorial Design
2. For Number of factors, enter 5
3. For Number of corner points, enter 8
4. For Replicates, enter 1
5. For Power values, enter 0.8
6. For Number of center points per block, enter 4
7. For Standard deviation, enter 8.97. Click OK.
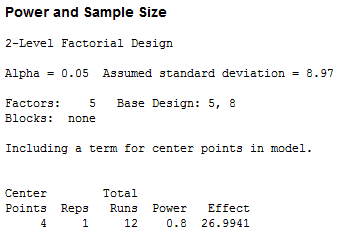
I got these results:

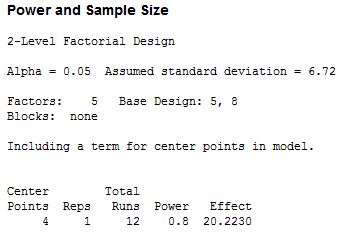
If I do one replicate, I have an 80% chance good chance to detect a difference in how far the gummi bears fly when I change a factor if that factor changes the distance by at least 27 inches. If I decide not to include the misfire in the data, and use 6.72, I get these results:

If the smaller standard deviation is true, the difference a factor has to make drops from about 27 inches closer to 20. That’s a pretty big difference. Because I know that the 6-inch observation represents a misfire, I’m comfortable leaving it out. That way, I use what I think is the more accurate estimate of the standard deviation.
Determining the Number of Replicates in Design of Experiments
While nearly 7 inches does seem like a significant drop, I think I’d like to be able to detect differences smaller than 20 inches. In fact, because my target is 4.5 inches, for the gummi bear experiment I think I want to be able to see an effect that size. Because I'm going to increase the number of replicates, and do a block for each replicate, I'm going to decrease the number of center points per block. To design an experiment that will let me estimate the number of replicates I need, I can:
1. Press CTRL+E to reopen the Power and Sample Size Dialog Box.
2. Erase the values in Replicates
3. In Effect, enter 4.5
4. In Power, enter 0.8
5. In Number of center points per block, enter 1.
6. Click Design. For Number of blocks, enter 11. Click OK in both dialog boxes.
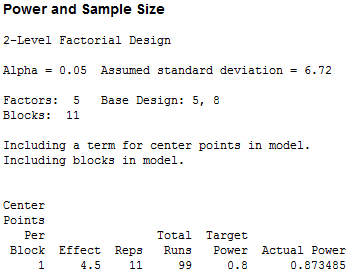
I get the following output:

The power calculation suggests that we need 99 runs to get at least 80% power. But we were using a resolution III design so that we didn’t have to do very many runs. If we’re going to do a lot of runs anyway, we should reconsider the number of corner points in the design.
1. Press CTRL+E
2. In Number of corner points, enter 32.
3. Click Design. For Number of blocks, enter 3. Click OK in both dialog boxes.
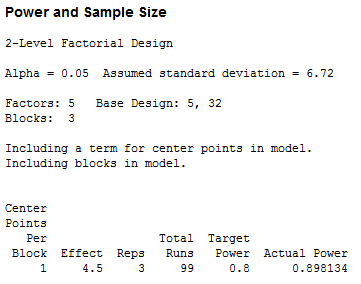
Here's the resulting output:

The full factorial design actually uses the same total number of runs as the resolution III design. Not only that, but I won’t have to return to another experiment later to figure out any interactions—which would involve collecting even more data.
It looks like I’ve signed myself up for a lot of gummi bear launching, but not without having thought through how to learn the most from the least amount of data. It’s definitely better than collecting my data and then realizing that I had to re-plan another experiment because I didn’t collect what I needed. That’s what the power calculations do for design of experiments.
Excited about standard deviation? Check out Variations on a Theme of Variation: R, V, SD, SE, and CI to keep your juices flowing.


