


by Matthew Barsalou, guest blogger
Once upon a time, in the Kingdom of Wetzlar, there was a farm with over a thousand chickens, two pigs, and a cow. The chickens were well treated, but a few rabble-rousers among them got the rest of the chickens worked up. These trouble-making chickens looked almost like the other chickens, but in fact they were evil chickens.
 By HerbertT - Eigenproduktion, CC BY-SA 3.0, https://commons.wikimedia.org/w/index.php?curid=962579 |
Hidden among the good chickens and the evil chickens was Sid. Sid was not like other chickens. He was a secret spy for The Swan of the Lahn, who ruled Wetzlar and was concerned about the infiltration of evil chickens. Sid was also a duck. That's right, a duck disguised as a chicken. Sid knew who the evil chickens were, and sent regular reports on their activities back to Wetzler.
 Mallard drake by Bert de tilly |
One stormy and dark night, an evil chicken snuck out with an enormous basket of beautiful hand-painted eggs to throw at the two pigs and the cow. Sid snuck out into the pouring rain and took a sample of 18 of the eggs. The intrepid duck spy was familiar with a previous study of 157 eggs, which showed that the mean of those eggs was 57.079 grams with a standard deviation of 2.30 grams. Sid was determined to find out if the mean of his current samples had a statistically significant difference from the mean of the previous study.
 By Jan Kameníček - Own work, Public Domain, https://commons.wikimedia.org/w/index.php?curid=732984 |
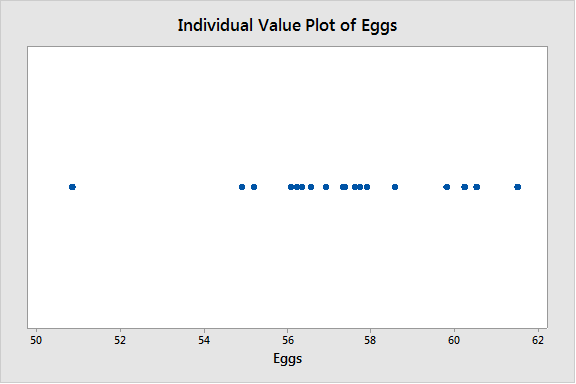
If you'd like to recreate Sid's analysis, download his data set and, if you need it, the free trial of Minitab 18 Statistical Software. We will need to use summarized data since we only have actual values for the sample from the study and not the full data set. Go to Stat > Basic Statistics > Display Descriptive Statistics... and select the column containing the data as the Variable. Click on Graphs and select Individual value plot to view a graph of the data.
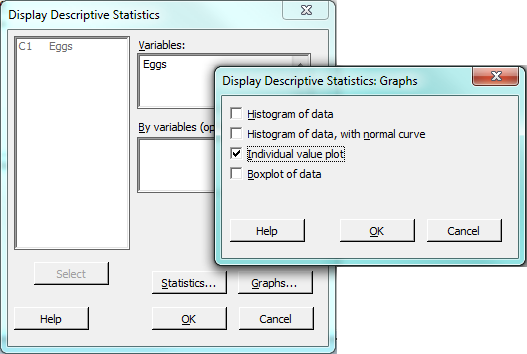
Click OK twice and Minitab will create an individual value plot of the data and the mean and standard deviation will appear in the session window with the rest of the descriptive statistics.
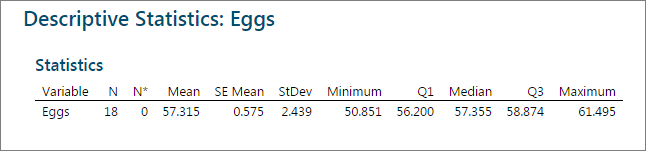
We can see that the sample mean is 57.315 and the standard deviation is 2.439 so now we can perform a 2 sample t-test to compare the means by going to Stat > Basic Statistics > 2-Sample t... and selecting Summarized data in the drop down menu. Enter the sample size of 18, sample mean of 57.315 and standard deviation of 2.439 under Sample 1 and enter the sample size of 157, mean of 57.079, and the population standard deviation of 2.30 under Sample 2.
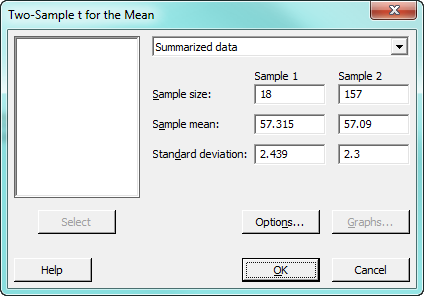
Then click OK.
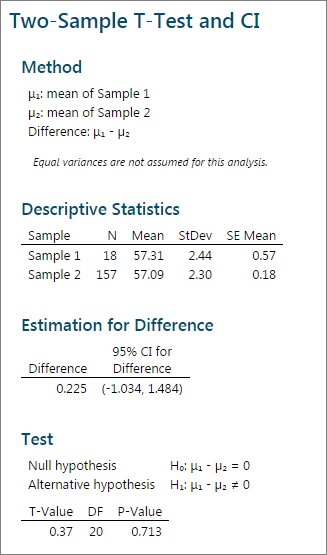
The p -value is greater than 0.05 so we can conclude there is no statistically significant difference between the means of the eggs the evil chickens planned to throw and the eggs in the previous study.
Unfortunately, Sid made a critical mistake. The first step in an analysis is to ask the right question. Sid's statistics were correct, but he asked the wrong question: “Is the mean of the second sample different from the mean of the first sample with an alpha of 0.05?”
What he should have asked was, “What will happen when the pigs and the cow get hit by eggs?” The weight of the eggs was irrelevant; what mattered was the consequences of the pigs and cow being pummeled with eggs.
If Sid had prepared a report for The Swan of the Lahn that only said the eggs collected by the evil chickens weighed the same as eggs in the earlier study, the Swan would conclude that the process had not changed. But had the right question been answered, the correct conclusion would have been, “Trouble may be brewing.”
|
By Dick Daniels (http://carolinabirds.org/) - Own work, CC BY-SA 3.0, https://commons.wikimedia.org/w/index.php?curid=11053305 |

Trouble did indeed result when the evil chickens put their egg-throwing plan into action. As darkness fell, first the cow and then the pigs were bombarded by egg after messy egg.
The cow simply ate the eggs. But the pigs, holding all the chickens to be responsible, were outraged. They rampaged and terrorized the poor chickens all that night. By midnight, the muddy fields were full of pig prints and feathers were ruffled in the chicken coop.
One of the evil chickens seized on the traumatized crowd's passions, and demanded of the others, “How can we live like this?" The evil chickens soon convinced the others that they would all be happier if they moved to the high-walled village of Wetzlar beside the Lahn River. The chickens began to march into the stormy night.
About the Guest Blogger
Matthew Barsalou is a statistical problem resolution Master Black Belt at BorgWarner Turbo Systems Engineering GmbH. He is a Smarter Solutions certified Lean Six Sigma Master Black Belt, ASQ-certified Six Sigma Black Belt, quality engineer, and quality technician, and a TÜV-certified quality manager, quality management representative, and auditor. He has a bachelor of science in industrial sciences, a master of liberal studies with emphasis in international business, and has a master of science in business administration and engineering from the Wilhelm Büchner Hochschule in Darmstadt, Germany. He is author of the books Root Cause Analysis: A Step-By-Step Guide to Using the Right Tool at the Right Time, Statistics for Six Sigma Black Belts and The ASQ Pocket Guide to Statistics for Six Sigma Black Belts.