---
title: "A Six Sigma Healthcare Project, part 2: Visualizing the Impact of Individual Factors"
description: "A Six Sigma Healthcare Project, part 2: Visualizing the Impact of Individual Factors"
image: https://blog.minitab.com/hubfs/B2BML%20-%20NEW%20FILE%20MANAGER%20STRUCTURE/Blog%20Images/Imported_Blog_Media/heart_stetho-3.png
---
English
- [English](https://blog.minitab.com/en/?hsLang=en)
- [Français](https://blog.minitab.com/fr/?hsLang=en)
- [Deutsch](https://blog.minitab.com/de/?hsLang=en)
- [Português](https://blog.minitab.com/pt/?hsLang=en)
- [Español](https://blog.minitab.com/es/?hsLang=en)
- [日本語](https://blog.minitab.com/ja/?hsLang=en)
- [한국어](https://blog.minitab.com/ko/?hsLang=en)
- [中文(简体)](https://blog.minitab.com/zh/?hsLang=en)
- [ Partners](https://www.minitab.com/en-us/company/partners/)
- [ Contact](https://www.minitab.com/en-us/company/contact-us/)
- [ Talk to Minitab](https://www.minitab.com/en-us/talk-to-minitab/)
- [ My Account](https://licensing.minitab.com/account/manage)
[](https://www.minitab.com/en-us/)
- Products
Back
[Products](https://www.minitab.com/en-us/products/)
[All Products](https://www.minitab.com/en-us/products/)
- [Minitab Solution Center](https://www.minitab.com/en-us/products/minitab-solution-center/)
- [Minitab Statistical Software](https://www.minitab.com/en-us/products/minitab/)
- [Minitab Connect](https://www.minitab.com/en-us/products/connect/)
- [Minitab Model Ops](https://www.minitab.com/en-us/products/model-ops/)
- [Minitab Education Hub](https://www.minitab.com/en-us/products/education-hub/)
- [Minitab Engage](https://www.minitab.com/en-us/products/engage/)
- [Minitab Workspace](https://www.minitab.com/en-us/products/workspace/)
- [Real-Time SPC](https://www.minitab.com/en-us/products/real-time-spc/)
- [Prolink Data Collection & SPC](https://www.minitab.com/en-us/products/prolink)
- [Simul8 Discrete Event Simulation](https://info.minitab.com/en/new-to-simul8?hsLang=en)
- [SPM](https://www.minitab.com/en-us/products/spm/)
- Solutions
Back
[Solutions](https://www.minitab.com/en-us/solutions/)
[All Solutions](https://www.minitab.com/en-us/solutions/)
- [Analytics](https://www.minitab.com/en-us/solutions/analytics/)
- [Statistics & Predictive Analytics](https://www.minitab.com/en-us/solutions/analytics/statistical-analysis-predictive-analytics/)
- [Data Science & Machine Learning](https://www.minitab.com/en-us/solutions/analytics/data-science-machine-learning/)
- [Business Analytics & Intelligence](https://www.minitab.com/en-us/solutions/analytics/business-analytics-intelligence/)
- [Statistical Process Control](https://www.minitab.com/en-us/solutions/analytics/statistical-process-control/)
- [Quality Analytics](https://www.minitab.com/en-us/solutions/analytics/quality-analytics/)
- [Live Analytics](https://www.minitab.com/en-us/solutions/analytics/live-analytics/)
- [Reliability & Life Data Analysis](https://www.minitab.com/en-us/solutions/analytics/reliability/)
- [Discrete Event Simulation](https://info.minitab.com/en/new-to-simul8?hsLang=en)
- [Process Mining](https://info.minitab.com/en/new-to-simul8?hsLang=en)
- [Key Capabilities](https://www.minitab.com/en-us/solutions/key-capabilities/)
- [Continuous Improvement](https://www.minitab.com/en-us/solutions/key-capabilities/continuous-improvement/)
- [Data Integration & Data Prep](https://www.minitab.com/en-us/solutions/key-capabilities/data-integration-data-prep/)
- [Diagramming & Mind Mapping](https://www.minitab.com/en-us/solutions/key-capabilities/diagramming-mind-mapping/)
- [Digital Twins](https://info.minitab.com/en/new-to-simul8?hsLang=en)
- [Model Deployment & ML Ops](https://www.minitab.com/en-us/solutions/key-capabilities/model-deployment-ml-ops/)
- [Innovation & Project Management](https://www.minitab.com/en-us/solutions/key-capabilities/innovation-project-management/)
- [Process Excellence: Detect, Correct & Prevent](https://www.minitab.com/en-us/solutions/key-capabilities/process-excellence/)
- [Featured Industries](https://www.minitab.com/en-us/solutions/industry/)
- [Academic](https://www.minitab.com/en-us/solutions/industry/academic/)
- [Energy & Natural Resources](https://www.minitab.com/en-us/solutions/industry/energy-resources/)
- [Government & Public Sector](https://www.minitab.com/en-us/solutions/industry/government/)
- [Healthcare](https://www.minitab.com/en-us/solutions/industry/healthcare/)
- [Insurance](https://www.minitab.com/en-us/solutions/industry/insurance/)
- [Manufacturing & Industrial](https://www.minitab.com/en-us/solutions/industry/manufacturing-industrial/)
- [Services](https://www.minitab.com/en-us/solutions/industry/service-industries/)
- [Software & Technology](https://www.minitab.com/en-us/solutions/industry/software-technology/)
- [Construction](https://www.minitab.com/en-us/solutions/industry/construction/)
- [Featured Roles](https://www.minitab.com/en-us/solutions/role/)
- [Engineering](https://www.minitab.com/en-us/solutions/role/engineering/)
- [Business Analysis](https://www.minitab.com/en-us/solutions/role/business-analysts/)
- [Information Technology](https://www.minitab.com/en-us/solutions/role/information-technology/)
- [Supply Chain](https://www.minitab.com/en-us/solutions/role/supply-chain/)
- [Customer Service & Contact Center](https://www.minitab.com/en-us/solutions/role/customer-service-contact-center/)
- [Human Resources](https://www.minitab.com/en-us/solutions/role/human-resources/)
- [Marketing](https://www.minitab.com/en-us/solutions/role/marketing/)
- [Research and Development](https://www.minitab.com/en-us/solutions/role/research-and-development/)
- Resources & Services
Back
[Resources & Services](https://www.minitab.com/en-us/resources-services/)
[All Resources & Services](https://www.minitab.com/en-us/resources-services/)
- [Resources](https://www.minitab.com/en-us/resources-services/resources/)
- [Case Studies](https://www.minitab.com/en-us/resources-services/resources/case-studies/)
- [eBooks & White Papers](https://www.minitab.com/en-us/resources-services/resources/ebooks-and-white-papers/)
- [Blog](https://blog.minitab.com/blog/?hsLang=en)
- [Data Sets](https://www.minitab.com/en-us/resources-services/resources/data-set/)
- [Webinars & Events](https://www.minitab.com/en-us/resources-services/resources/events/)
- [Education Hub](https://www.minitab.com/en-us/resources-services/resources/education-hub/)
- [Services](https://www.minitab.com/en-us/resources-services/services/)
- [Training](https://www.minitab.com/en-us/resources-services/services/training/)
- [Deployment](https://www.minitab.com/en-us/resources-services/services/deployment/)
- [Consulting](https://www.minitab.com/en-us/resources-services/services/statistical-consulting/)
- [Self-Paced Learning](https://www.minitab.com/en-us/resources-services/services/self-paced-learning/)
- [Continuing Education](https://www.minitab.com/en-us/resources-services/services/continuing-education/)
- Support
Back
[Support](https://www.minitab.com/en-us/support/)
[Technical Support](https://www.minitab.com/en-us/support/)
- [Subscriptions & Activation](https://www.minitab.com/en-us/support/subscriptions-and-activation/)
- [Minitab Quick Start](https://www.minitab.com/en-us/support/quick-start/)
- [Training](https://www.minitab.com/en-us/resources-services/services/training/)
- [Installation Support](https://www.minitab.com/en-us/support/installation/)
- [Support Videos](https://www.minitab.com/en-us/support/videos/)
- [Support Documentation](https://www.minitab.com/en-us/support/documents/)
- [Software Updates](https://www.minitab.com/en-us/support/software-updates/)
- [Product Downloads](https://www.minitab.com/en-us/support/downloads/)
- [Support Policy](https://www.minitab.com/en-us/support/policy/)
- Company
Back
[Company](https://www.minitab.com/en-us/company/)
[Company](https://www.minitab.com/en-us/company/)
- [About Us](https://www.minitab.com/en-us/company/our-company/)
- [Leadership Team](https://www.minitab.com/en-us/company/leadership-team/)
- [Partners](https://www.minitab.com/en-us/company/partners/)
- [Careers](https://www.minitab.com/en-us/company/careers/)
- [Contact](https://www.minitab.com/en-us/company/contact-us/)
- [News](https://www.minitab.com/en-us/company/press-releases/)
[Try/Buy](https://www.minitab.com/en-us/try-buy/)
- [Statistics](https://blog.minitab.com/en/blog/tag/statistics)
- [Data Analysis](https://blog.minitab.com/en/blog/tag/data-analysis)
-
- [Quality Improvement](https://blog.minitab.com/en/blog/tag/quality-improvement)
- [Subscribe](https://info.minitab.com/blog/subscribe?hsLang=en)

## Notice
You are now leaving minitab.com.
Click Continue to proceed to:
Continue
Go Back
# A Six Sigma Healthcare Project, part 2: Visualizing the Impact of Individual Factors
Minitab Blog Editor | 6/1/2016
Topics: [Healthcare](https://blog.minitab.com/en/blog/tag/healthcare)
- [Share](https://www.linkedin.com/shareArticle?mini=true&url=https://blog.minitab.com/en/blog/understanding-statistics/a-six-sigma-healthcare-project-part-2-visualizing-the-impact-of-individual-factors)
- [Share](https://www.facebook.com/sharer.php?u=https://blog.minitab.com/en/blog/understanding-statistics/a-six-sigma-healthcare-project-part-2-visualizing-the-impact-of-individual-factors)
My previous post covered the initial phases of [a project to attract and retain more patients in a cardiac rehabilitation program](https://blog.minitab.com/blog/understanding-statistics/a-six-sigma-healthcare-project-part-1-examining-factors-with-a-pareto-chart?hsLang=en), as described in a 2011 *Quality Engineering* article. A Pareto chart of the reasons enrolled patients left the program indicated that the hospital could do little to encourage participants to attend a greater number of sessions, so the team focused on increasing initial enrollment from 32 to 36 patients per month.
Stakeholders offered several solutions. Before implementing any improvement strategy, however, the team decided to look at how other individual factors influenced patient participation in the program. Taking this step can help avoid devoting resources to "fixing" factors that have little impact on the outcome.
In this post, we will look at how the team analyzed those individual factors. We have (simulated) data from 500 patients, including:
- Address and distance between each patient's home and hospital
- Each patient's age and gender
- Whether or not the patient had a car
- Whether or not the patient participated in the program
Download the [data set](https://cdn.app.compendium.com/uploads/user/458939f4-fe08-4dbc-b271-efca0f5a2682/479b4fbd-f8c0-4011-9409-f4109cc4c745/Image/521a4efabc5f892eef403e8c4a354f9a/cardiacparticipationdata_1.mtw) to follow along and try these analyses yourself. If you don't already have Minitab, you can [download and use our statistical software free for 30 days](http://www.minitab.com/products/minitab/free-trial/).
The team used simple statistics and graphs to get some preliminary insight into how these different factors affected whether or not patients decided to participate in the rehabilitation program.
## Looking at the Influence of Distance on Patient Participation
The team looked first at the influence of distance on participation using a [boxplot](https://blog.minitab.com/blog/statistics-and-quality-data-analysis/how-to-think-outside-the-boxplot?hsLang=en). Also known as a box-and-whisker diagram, the boxplot gives you an indication of your data's general shape, central tendency, and variability with a single glance. Displaying boxplots side-by-side lets you easily compare the distribution of data between groups. You can easily compare the central value and spread of the distribution for each group and determine if the data for each group are symmetric about the center.
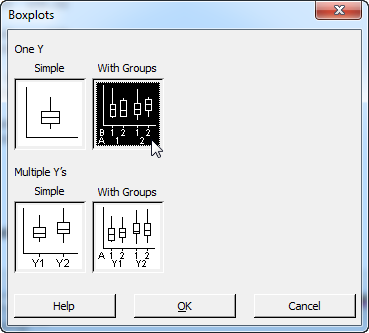
To create this graph, open the patient data set in Minitab and select **Graph \> Boxplot \> One Y With Groups**.
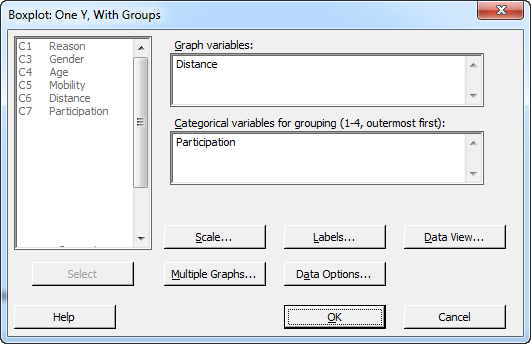
In the dialog box, select "Distance" as the graph variable, choose "Participation" as the categorical variable, and click **OK**.
Minitab generates the following graph:
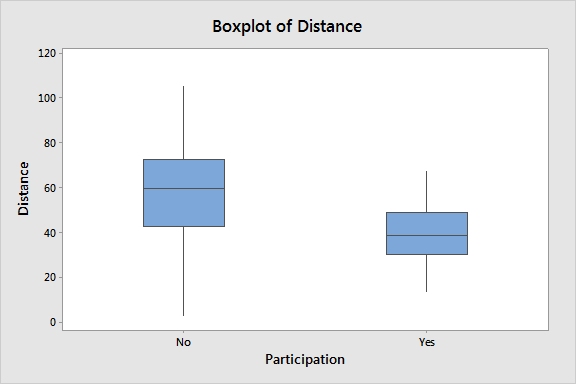
The boxplot indicates that patients who live closer to the hospital are more likely to participate in the program. This is valuable, but it would be interesting to know more about the relationship between distance and participation. But because "Participation" is a binary response—a patient either participates, or does not—we can't visualize that relationship directly with graphs that require a [continuous](https://blog.minitab.com/blog/understanding-statistics/why-is-continuous-data-better-than-categorical-or-discrete-data?hsLang=en) response.
However, to get a bit more insight, the project team divided the patients into groups according to how far away from the hospital they live, then calculated the relative percentage of participation for each group. To do this, select **Data \> Recode \> To Text...** and complete the dialog box using the following groups. The picture below shows only the first five of the seven groups, so here is the complete list:
Group 1: 0 to 25 km
Group 2: 25 to 35 km
Group 3: 35 to 45 km
Group 4: 45 to 55 km
Group 5: 55 to 65 km
Group 6: 65 to 75 km
Group 7: 75 to 200 km
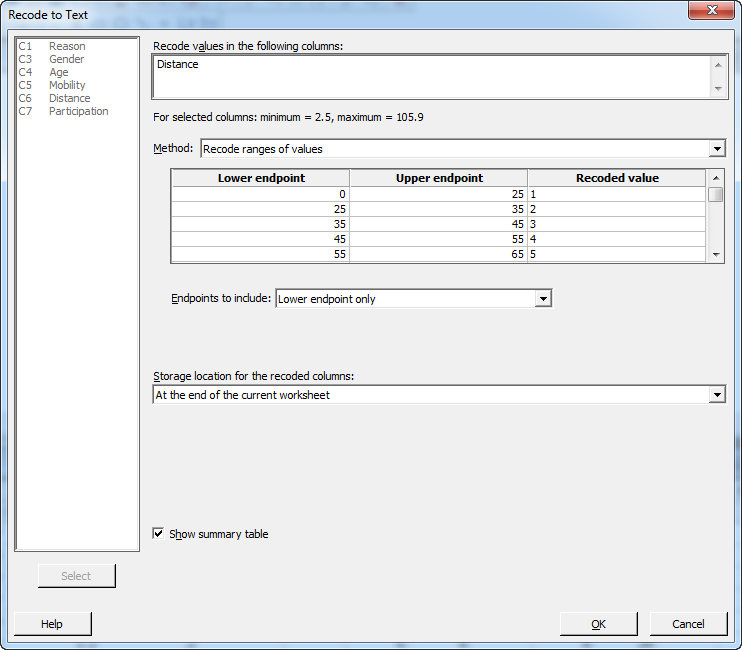
When you recode the data, Minitab creates new columns of coded data and provides a summary in the Session Window:
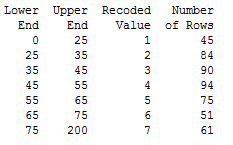
Minitab automatically names the new column of data "Recoded Distance," which I've renamed as "Distance Group."
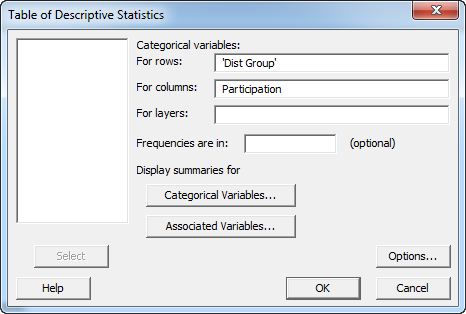
To determine the relative frequency of participation among each group, choose **Stat \> Tables \> Descriptive Statistics...** In the dialog box, select 'Distance Group' as the variable for rows, and Participation as the variable for columns, as shown. Click on the "Categorical Variables" button and make sure 'Counts' and 'Row percents' are selected, then press **OK** twice.
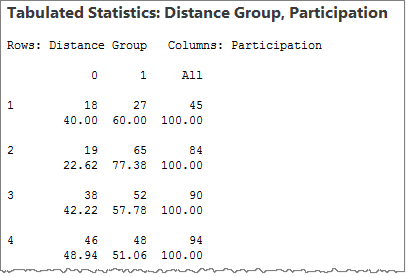
In the session window, Minitab will display a table that shows the total number in each distance group, the number participating, and the relative frequency of participation for each group.
If we enter that information into the Minitab worksheet like this:
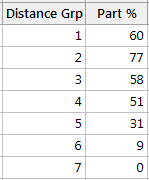
we can create a scatterplot that reveals more about the relationship between distance and participation. Select **Graph \> Scatterplot...**, and choose "With connect line."
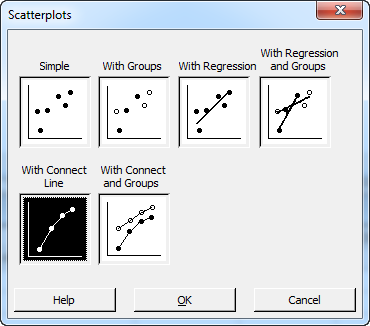
Select 'Part %' as the Y variable and 'Distance Grp' as the X variable, and Minitab creates the following graph, which shows the relationship between distance and participation more clearly:
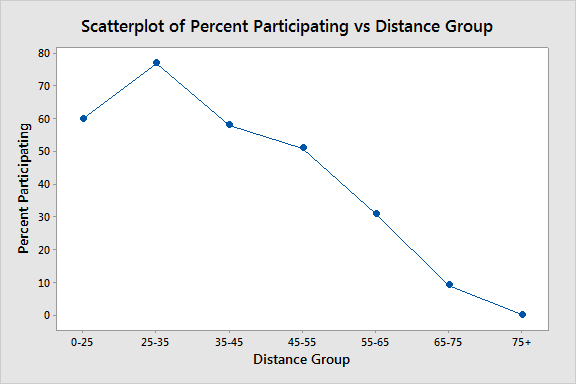
We can see that the percentage of participation is very high among patients who live closest to the hospital, but decreases steadily among groups who lived further than 45 miles away.
## Looking at the Influence of Age on Patient Participation
We can use the same methods to get initial insight into how age affects a patient's likelihood of participation in the program. The boxplot below indicates age does have some influence on participation:
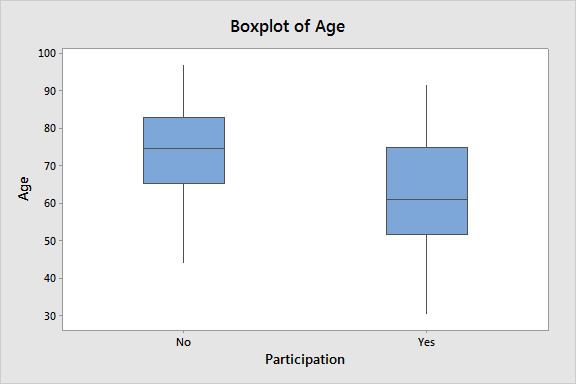
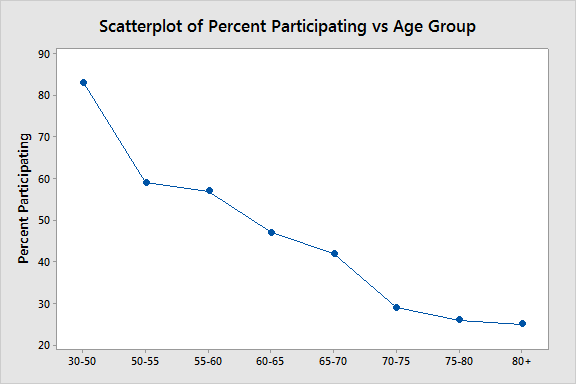
By dividing the patient data into groups based on Age as we did for Distance, as detailed in the table below, we can create a similar rough scatterplot to enhance our understanding of the relationship between these variables. We’ll divide the data as shown here before using **Stat \> Tables \> Descriptive Statistics…** to determine the relative participation rates:
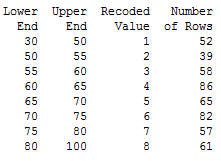
The scatterplot of the relative frequency of participation for patients in each Age group again yields greater insight into the relationship between this factor and the likelihood of participation. In this case, a much higher percentage of patients in the younger groups take part.
## Looking at the Influence of Mobility and Gender on Patient Participation
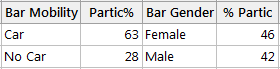
Because both "Mobility" and "Participation" are binary variables, we can select **Stat \> Tables \> Descriptive Statistics...** to give us a tabular view of the data. Select "Mobility" as the row, and Participation as the columns, and Minitab will provide the following output, which gives you percentages of participation among those patients who do not own a car and those who do.
We can put these data into a bar chart for a quick visual assessment. Minitab offers several ways to accomplish this easily; I opted to place the table data for each variable into the worksheet as shown here:
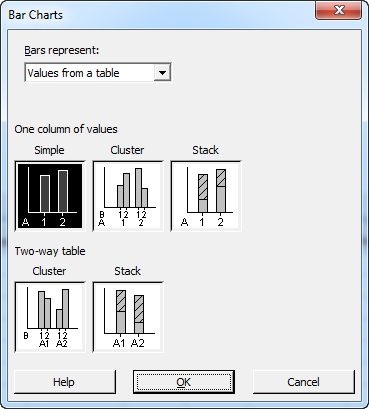
Now, by selecting **Graph \> Bar Chart**, and choosing a simple chart in which "Bars represent values from a table"...
we can create the following bar charts that show the proportion of those with and without cars who participate in the program, and the proportion of men and women who participate:
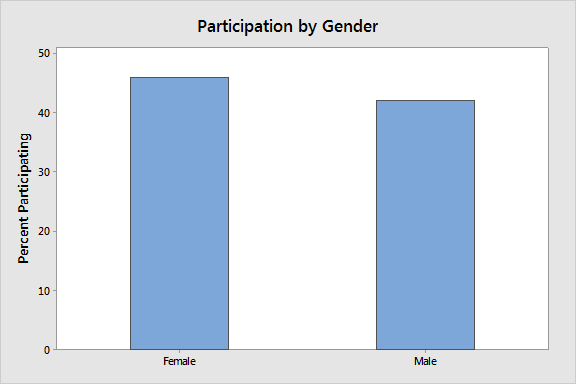
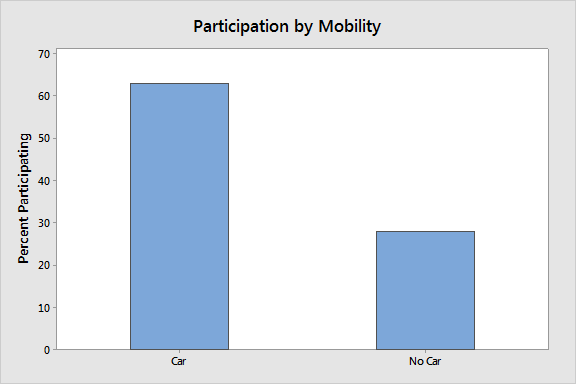
It appears that gender could have a slight influence on participation, but the impact of having a car on participation is clearly an important factor.
An initial look at these factors indicates that access to the hospital is very important in getting people to participate. Offering a bus or shuttle service for people who do not have cars might be a good way to increase participation, but only if such service doesn't cost more than the amount of increased revenue it might generate by increasing participation.
In the next part of this series, we'll use binary logistic regression—which is not as scary as it might sound—to develop [a model that will let us predict the probability a patient will join the program](https://blog.minitab.com/blog/understanding-statistics/a-six-sigma-healthcare-project-part-3-creating-binary-logistic-regression-models-for-patient-participation?hsLang=en) based on the influence factors we've looked at. A good estimate of that probability will enable us to calculate the break-even point for such a service.
## You Might Also Like
[Inside the 2025 IHI Forum: What Healthcare Leaders Are Saying About AI](https://blog.minitab.com/en/blog/ihi-forum-healthcare-and-ai?hsLang=en)
[Minitab Ai](https://blog.minitab.com/en/blog/tag/minitab-ai) | 5 Minute Read
[Five Approaches to Enhance Patient Safety](https://blog.minitab.com/en/blog/five-approaches-to-enhance-patient-safety?hsLang=en)
[Operations](https://blog.minitab.com/en/blog/tag/operations) | 5 Minute Read
[Navigating Healthcare Challenges for the 3 Ps + 1](https://blog.minitab.com/en/blog/3ps-healthcare-challenges?hsLang=en)
[Minitab](https://blog.minitab.com/en/blog/tag/minitab) | 5 Minute Read
---
- [Careers](https://www.minitab.com/en-us/company/careers/)
- [Trust Center](https://www.minitab.com/en-us/trust-center/)
- [Suppliers](https://www.minitab.com/en-us/suppliers/)
- [Site Map](https://www.minitab.com/en-us/site-map/)
- [](https://www.linkedin.com/company/minitab/)
- [](https://www.facebook.com/Minitab/)
- [](https://www.youtube.com/user/MinitabInc)
- [](https://www.instagram.com/minitab/)
---
© 2025 Minitab, LLC. All Rights Reserved.
- [Terms of Use](https://www.minitab.com/en-us/legal/terms-of-use/)
- [Privacy Policy](https://www.minitab.com/en-us/legal/privacy-policy/)
- [Legal](https://www.minitab.com/en-us/legal/)
- Cookies Settings