


Analysis of variance (ANOVA) is great when you want to compare the differences between group means. For example, you can use ANOVA to assess how three different alloys are related to the mean strength of a product. However, most ANOVA tests assess one response variable at a time, which can be a big problem in certain situations. Fortunately, Minitab statistical software offers a multivariate analysis of variance (MANOVA) test that allows you to assess multiple response variables simultaneously.
In this post, I’ll run through a MANOVA example, explain the benefits, and cover how to know when you should use MANOVA.
Limitations of ANOVA
Whether you’re using general linear model (GLM) or one-way ANOVA, most ANOVA procedures can only assess one response variable at a time. Even GLM, where you can include many factors and covariates in the model, the analysis simply cannot detect multivariate patterns in the response variable.
This limitation can be a huge roadblock for some studies because it may be impossible to obtain significant results with a regular ANOVA test. You don’t want to miss out on any significant findings!
Example That Compares MANOVA to ANOVA
What the heck are multivariate patterns in the response variable? It sounds complicated but it’s very easy to show the difference between how ANOVA and MANOVA tests the data by using graphs.
Let’s assume that we are studying the relationship between three alloys and the strength and flexibility of our products. Here is the dataset for the example.
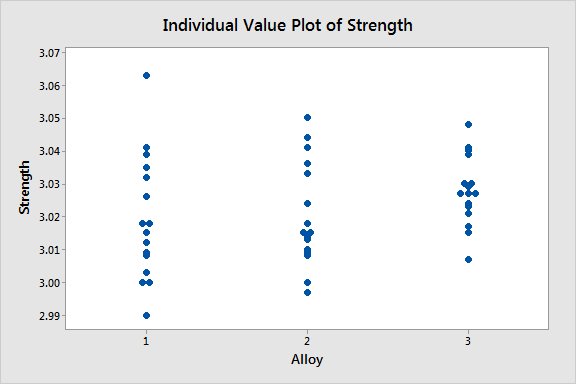
The two individual value plots below show how one-way ANOVA analyzes the data—one response variable at a time. In these graphs, alloy is the factor and strength and flexibility are the response variables.
 |
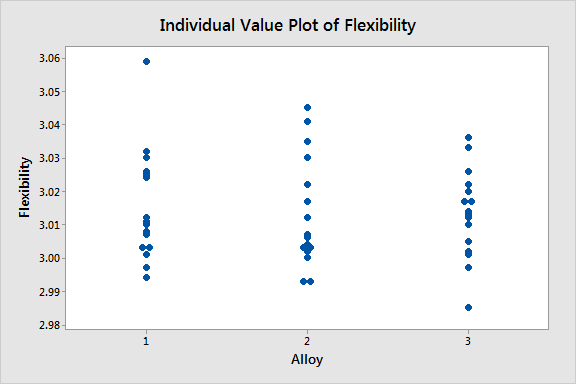 |
The two graphs seem to show that the type of alloy is not related to either the strength or flexibility of the product. When you perform the one-way ANOVA procedure for these graphs, the p-values for strength and flexibility are 0.254 and 0.923 respectively.
Drat! I guess Alloy isn't related to either Strength or Flexibility, right? Not so fast!
Now, let’s take a look at the multivariate response patterns. To do this, I’ll display the same data with a scatterplot that plots Strength by Flexibility with Alloy as a categorical grouping variable.
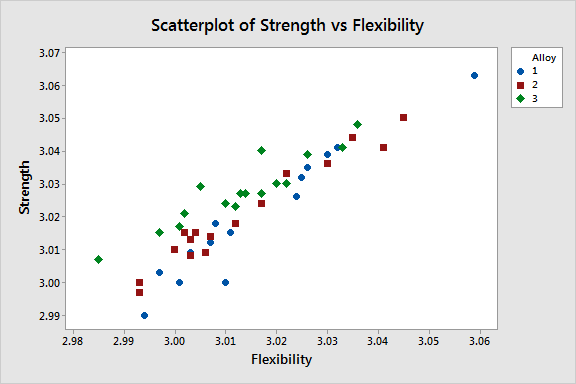
The scatterplot shows a positive correlation between Strength and Flexibility. MANOVA is useful when you have correlated response variables like these. You can also see that for a given flexibility score, Alloy 3 generally has a higher strength score than Alloys 1 and 2. We can use MANOVA to statistically test for this response pattern to be sure that it’s not due to random chance.
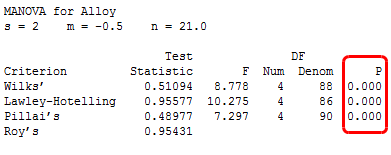
To perform the MANOVA test in Minitab, go to: Stat > ANOVA > General MANOVA. Our response variables are Strength and Flexibility and the predictor is Alloy.
Whereas one-way ANOVA could not detect the effect, MANOVA finds it with ease. The p-values in the results are all very significant. You can conclude that Alloy influences the properties of the product by changing the relationship between the response variables.
For a more complete guide on how to interpret MANOVA results in Minitab, go to: Help > StatGuide > ANOVA > General MANOVA.
When and Why You Should Use MANOVA
Use multivariate ANOVA when you have continuous response variables that are correlated. In addition to multiple responses, you can also include multiple factors, covariates, and interactions in your model. MANOVA uses the additional information provided by the relationship between the responses to provide three key benefits.
- Increased power: If the response variables are correlated, MANOVA can detect differences too small to be detected through individual ANOVAs.
- Detects multivariate response patterns: The factors may influence the relationship between responses rather than affecting a single response. Single-response ANOVAs can miss these multivariate patterns as illustrated in the MANOVA example.
- Controls the family error rate: Your chance of incorrectly rejecting the null hypothesis increases with each successive ANOVA. Running one MANOVA to test all response variables simultaneously keeps the family error rate equal to your alpha level.