


Hypothesis testing is an essential procedure in statistics. A hypothesis test evaluates two mutually exclusive statements about a population to determine which statement is best supported by the sample data. When we say that a finding is statistically significant, it’s thanks to a hypothesis test. How do these tests really work and what does statistical significance actually mean?
In this series of three posts, I’ll help you intuitively understand how hypothesis tests work by focusing on concepts and graphs rather than equations and numbers. After all, a key reason to use statistical software like Minitab is so you don’t get bogged down in the calculations and can instead focus on understanding your results.
To kick things off in this post, I highlight the rationale for using hypothesis tests with an example.
The Scenario
An economist wants to determine whether the monthly energy cost for families has changed from the previous year, when the mean cost per month was $260. The economist randomly samples 25 families and records their energy costs for the current year. (The data for this example is FamilyEnergyCost and it is just one of the many data set examples that can be found in Minitab’s Data Set Library.)
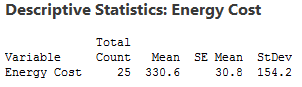
I’ll use these descriptive statistics to create a probability distribution plot that shows you the importance of hypothesis tests. Read on!
The Need for Hypothesis Tests
Why do we even need hypothesis tests? After all, we took a random sample and our sample mean of 330.6 is different from 260. That is different, right? Unfortunately, the picture is muddied because we’re looking at a sample rather than the entire population.
Sampling error is the difference between a sample and the entire population. Thanks to sampling error, it’s entirely possible that while our sample mean is 330.6, the population mean could still be 260. Or, to put it another way, if we repeated the experiment, it’s possible that the second sample mean could be close to 260. A hypothesis test helps assess the likelihood of this possibility!
Use the Sampling Distribution to See If Our Sample Mean is Unlikely
For any given random sample, the mean of the sample almost certainly doesn’t equal the true mean of the population due to sampling error. For our example, it’s unlikely that the mean cost for the entire population is exactly 330.6. In fact, if we took multiple random samples of the same size from the same population, we could plot a distribution of the sample means.
A sampling distribution is the distribution of a statistic, such as the mean, that is obtained by repeatedly drawing a large number of samples from a specific population. This distribution allows you to determine the probability of obtaining the sample statistic.
Fortunately, I can create a plot of sample means without collecting many different random samples! Instead, I’ll create a probability distribution plot using the t-distribution, the sample size, and the variability in our sample to graph the sampling distribution.
Our goal is to determine whether our sample mean is significantly different from the null hypothesis mean. Therefore, we’ll use the graph to see whether our sample mean of 330.6 is unlikely assuming that the population mean is 260. The graph below shows the expected distribution of sample means.

You can see that the most probable sample mean is 260, which makes sense because we’re assuming that the null hypothesis is true. However, there is a reasonable probability of obtaining a sample mean that ranges from 167 to 352, and even beyond! The takeaway from this graph is that while our sample mean of 330.6 is not the most probable, it’s also not outside the realm of possibility.
The Role of Hypothesis Tests
We’ve placed our sample mean in the context of all possible sample means while assuming that the null hypothesis is true. Are these results statistically significant?
As you can see, there is no magic place on the distribution curve to make this determination. Instead, we have a continual decrease in the probability of obtaining sample means that are further from the null hypothesis value. Where do we draw the line?
This is where hypothesis tests are useful. A hypothesis test allows us quantify the probability that our sample mean is unusual.
For this series of posts, I’ll continue to use this graphical framework and add in the significance level, P value, and confidence interval to show how hypothesis tests work and what statistical significance really means.
- Part Two: Significance Levels (alpha) and P values
- Part Three: Confidence Intervals and Confidence Levels
If you'd like to see how I made these graphs, please read: How to Create a Graphical Version of the 1-sample t-Test.