Most of the data that one can collect and analyze follow a normal distribution (the famous bell-shaped curve). In fact, the formulae and calculations used in many analyses simply take it for granted that our data follow this distribution; statisticians call this the "assumption of normality."
For example, our data need to meet the normality assumption before we can accept the results of a one- or two-sample t (Student) or z test. Therefore, it is generally good practice to run a normality test before performing the hypothesis test.
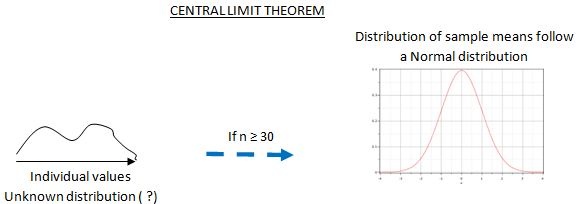
But wait...according to the Central Limit Theorem, when the sample size is larger than 30, normality is not a crucial prerequisite for a standard t (Student) or z hypothesis test: even though the individual values within a sample might follow an unknown, non-normal distribution, the sample means (as long as the sample sizes are at least 30) will follow a normal distribution.
Moreover, some tests are more robust to departures from normality. For example, if you use the Minitab Assistant, a two-sample T test requires only 15 values per sample. If the sample size is at least 15, normality is not an issue and the test is accurate even with non-normal data. Again, in the Minitab Assistant, a one-sample t test only requires at least 20 values in the sample. The reason for this is that the tests that are available in the Minitab Assistant have been modified in order to make them more robust to departures from normality.
What can you do when your sample sizes are still smaller than these threshold limit values and your data are not normally distributed ? The only remaining option is to use a nonparametric test. A nonparametric test is not based on any theoretical distribution. Therefore as a last resort and when all other options are exhausted, you can still use a nonparametric test.
In the service sector, for example, durations are often analyzed to improve processes (reduce waiting times, queuing times, lead times, payment times, faster replies to customer requests…). How long we wait for something is an important aspect of the customer experience, and ultimately influences customer satisfaction. Typically, duration times will not follow a normal distribution.
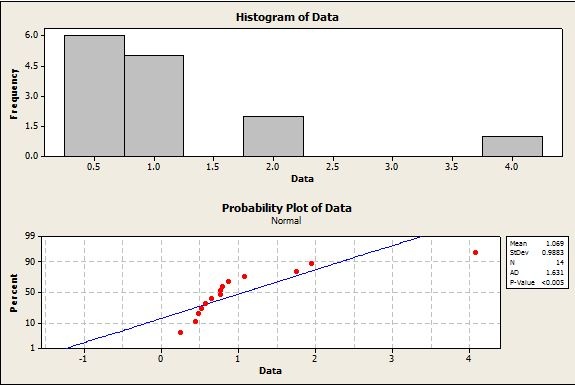
The P value in the probability plot above is smaller than 0.05, indicating that the data points do not follow a normal distribution. We can see a very significant curvature in the normal probability plot, and the points clearly do not follow the normal probability line. The histogram shows that the distribution is highly skewed to the right; also, the sample size is quite small (14).
This data set is an ideal candidate for a nonparametric approach.
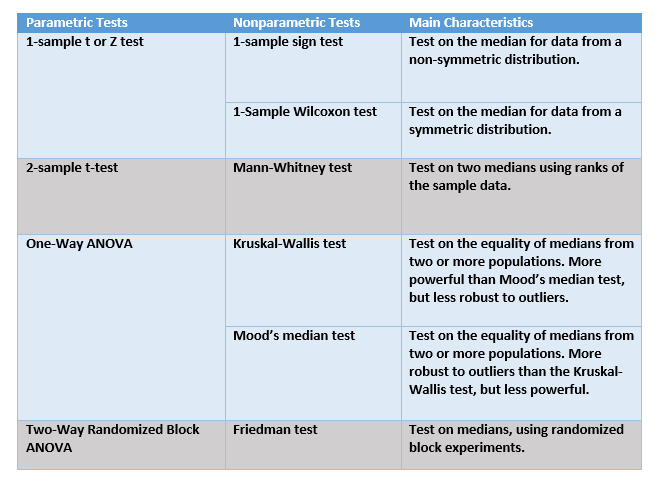
But which nonparametric test do we need to use in this situation? The correspondence table below shows how each nonparametric test (in Minitab, choose Stats > Non Parametric Tests) is related to a parametric test. This table provides a guideline for choosing the most appropriate nonparametric test in each case, along with the main characteristics of each nonparametric test.