


The Cp and Cpk are well known capability indices commonly used to ensure that a process spread is as small as possible compared to the tolerance interval (Cp), or that it stays well within specifications (Cpk).
Yet another type of capability index exists: the Cpm, which is much less known and used less frequently. The main difference between the Cpm and the other capability indices is that the bias from the target is directly taken into consideration in the Cpm. The bias is the difference between the process average and the target.
In Minitab, as soon as a target is entered into a capability analysis a Cpm gets calculated automatically. To obtain a good Cpm, a process needs to be right on target, whereas to obtain a satisfactory Cpk value, a process simply needs to stay well within specifications. This might seem to lead to the same conclusion; however, there is an obvious and major difference: with the Cpm, a direct penalty is incurred for not being exactly on target.
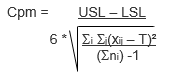
Where USL: Upper Specification limit, LSL: Lower specification limit, S: the standard deviation, and T: the target, and where:
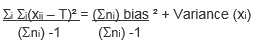
and
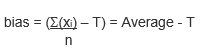
Notice that in the Cpm formula, above, bias is an input. The larger the bias, the smaller the Cpm value.
The Mismatch Issue
Why should we use the Cpm rather than the other capability indices? Because the Cpm is much more efficient at avoiding component mismatches.
Parts are often assembled together to manufacture a given product. In some cases, however, even though the Cpks of the individual parts are excellent, the resulting assembled system may be out of spec and suboptimal.
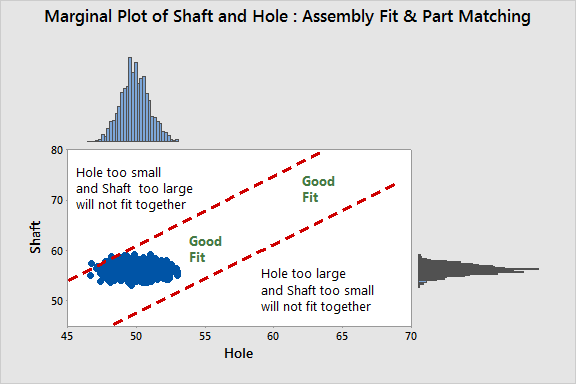
How could this happen? Suppose that two parts in an assembly are designed to fit together. For example a shaft is designed to have a sliding fit in a hole, the shaft must be a little bit smaller than the hole.
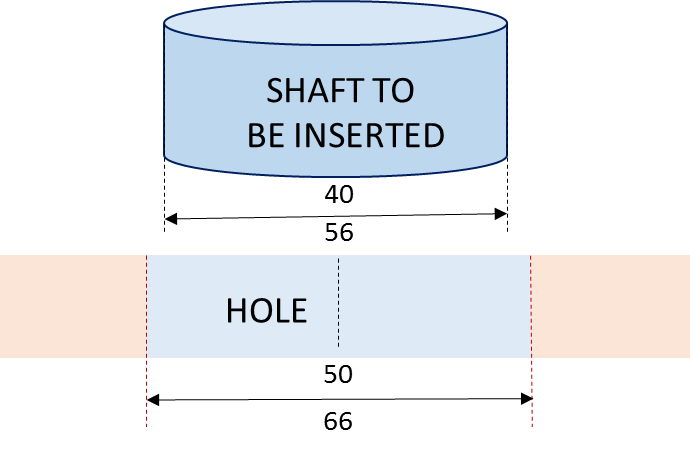
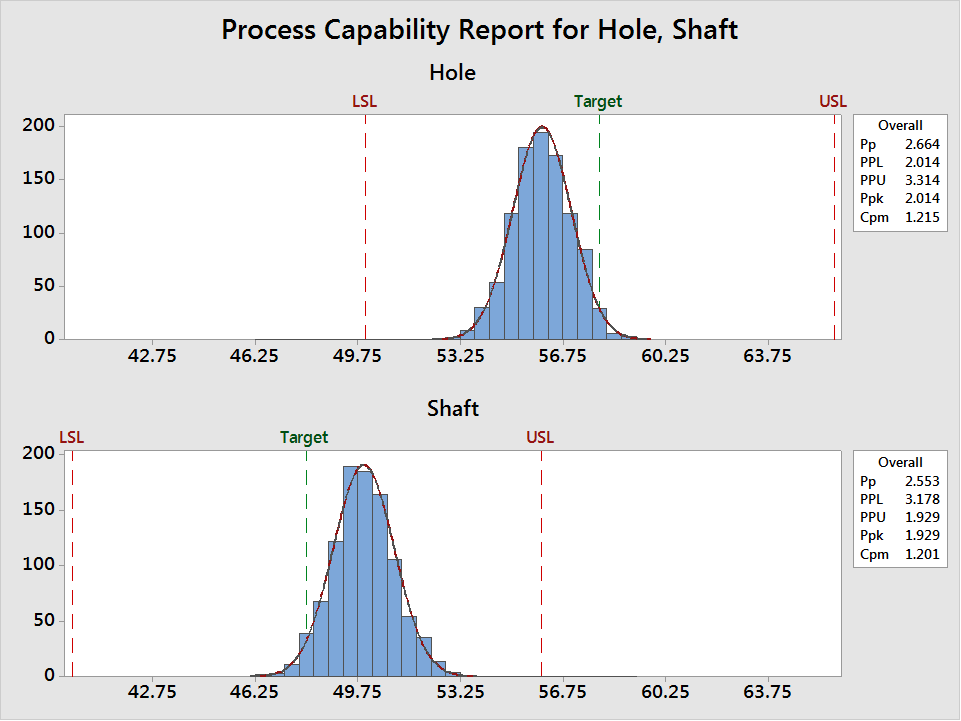
In the capability analyses below, the Ppks are excellent in both cases (close to 2 and the parts are well within tolerances), but the Cpms are low (close to 1.2) due to a significant shift from the targets. In the graph below, the shafts are larger than they should be and the holes are generally smaller than they should be (average above target). As a consequence, the two parts will often not fit together. It will sometimes become difficult to insert shafts into holes as the biases add up, thereby generating mismatches.
Keeping biases as small as possible is, therefore, essential. In complex systems, many parts or parameters interact together and should not be considered separately. As advanced products get more and more complex, with many parts subcontracted to external suppliers, matching all subsystems and parts and considering the performance of the system as a whole, rather than the quality of single parts in isolation from one another, becomes crucial.
In this context, the Cpm is clearly more efficient than other capability indices.
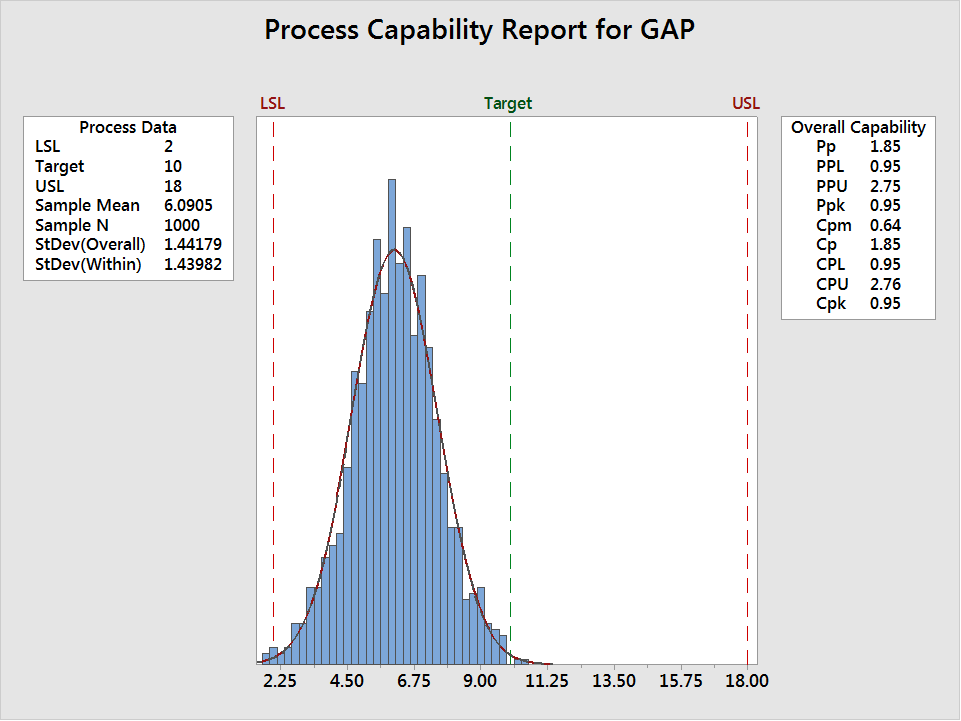
Consider the graph above, which displays the values of the resulting gaps (differences) between shafts and holes. The ideal gap should be 10 (target). The Ppk is poor (0.95), as expected, with some out-of-spec assembled products. The biases from the two individual parts were rather small initially, but they do add up, so that the resulting bias for the final assembly becomes relatively large.
If the bias is positive for shafts and also positive for holes, matching all parts together will certainly become easier, as the biases will compensate for one another. But in many cases, unfortunately, biases do add up. Only two parts have been considered in this very simple system; however, in the real world, products often contain many critical parts that are combined together.
Using Cpm for Asymmetrical Targets
Another advantage of the Cpm is that if the target is asymmetrical (in other words, if it is not halfway between the specs), the process average quality characteristic should be kept exactly on target. The Cpm is clearly more relevant in this context than the Ppk.
The Cpm capability index is based on the Taguchi loss curve concept. According to Taguchi (a well-known Japanese quality guru), as soon as the process mean deviates from the target, a loss is generated and quality becomes progressively worse. Therefore, just staying within specifications is not enough. The idea that customer losses are generated only when parts are out of specifications is naïve. A product that barely meets the specifications is, from the customer’s point of view, as good or as bad as the product that is barely outside of the specifications.
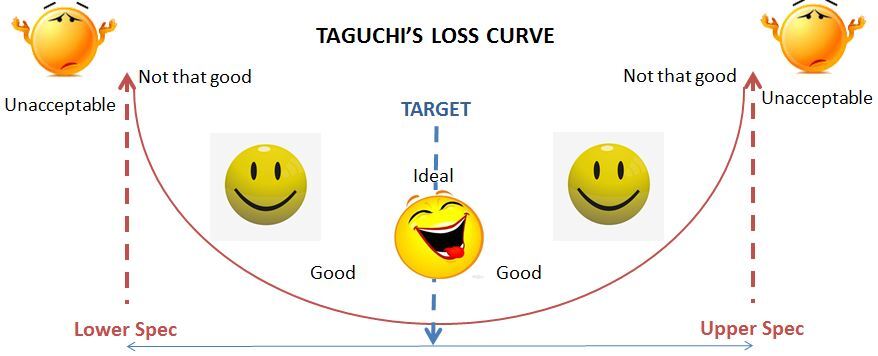
Quality loss curve : The quality loss is proportional to the square of the distance from the target value.
Conclusion
In the early days of the industrial revolution, skilled craftsmen would match parts together carefully. In the days of mass production, this became impossible due to a lack of time, to the complexity of many advanced high-tech products, and to the sheer number of parts that need to be assembled.
In this context, the Cpm capability index is very useful to avoid component mismatches. This is not only true for part dimensions but also for other part parameters which may also affect the final product when all these parts are combined together.