


Across all industries, there are many different ways professionals utilize Minitab Statistical Software to improve the quality of their products and services.
You may be a professional in the health care industry who is interested in monitoring the days between hospital-acquired infections (HAIs) using rare event charts. You may be a professional in manufacturing who is using a Pareto chart to evaluate the types of defects you are discovering during the inspection process. Or you may be a product manager like me who uses Minitab analytics to evaluate customer survey data.
But no matter the different applications, we all share a common thread.
Status Reports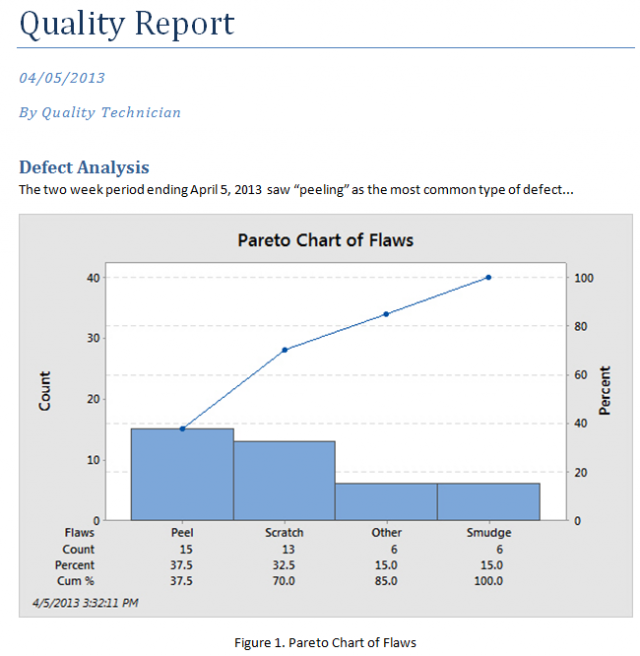
Many of us present reports to management and stakeholders at regular time intervals using Microsoft Word or PowerPoint. These reports communicate actionable information, supported with Minitab graphs and analysis.
We take pride in our reports. We want to impress our audience. It's our voice. So I guess it's no surprise that they can take quite a bit of time to prepare.
When we do prepare them, we want to maximize our time spent on the actual content while trying to minimize time spent on all of the non-value added activities.
We want to reduce our status report cycle time.
Status Reports: The Old Way
One step that can be somewhat laborious is updating our Minitab graphs in the status report.
We all know the drill. Every couple of weeks we create the same set of graphs and then manually copy and replace those same graphs into our latest status report.
And then, right when we are ready to send the report late on a Friday afternoon...the data change and we have to do it again! Yes, it happened to me once and I was consequently late with the family pizza—but that's a separate post altogether.
Bruno Scibilia wrote a great blog post on how to use Minitab macros to publish reports. Now let's also learn how to use Minitab macros and Microsoft Word together to automatically update our reports.
Status Reports: The New Way
“I’m a Quality Engineer at a manufacturing plant and I inspect our product daily looking for defects. If the product does have a defect, I record the type of defect in Microsoft Excel. Every two weeks, I run my executable in Minitab that imports the data from Excel and creates a Pareto chart. I then copy and paste the graphs into a report template for management.”
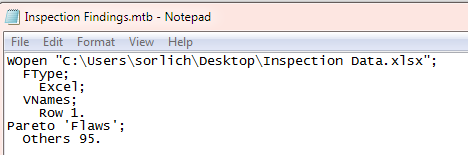
The engineer’s Minitab executable may look something like this:
Now, let’s add three additional subcommands to the Pareto chart command:
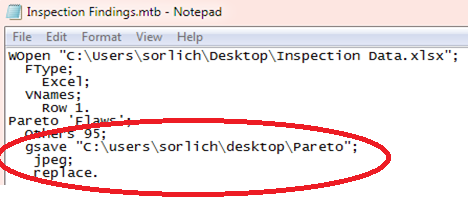
These subcommands instruct the executable to save the Pareto chart to a file location as a JPEG file and to automatically replace the current Pareto chart, if one exists. That's it from the Minitab side!
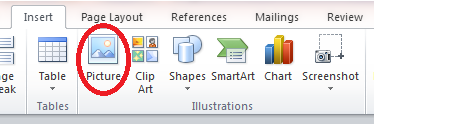
Now let’s set up the link to the Pareto chart in Microsoft Word. Within Microsoft Word, first click in the document where you'd like to display the Pareto Chart, go to the Insert tab, and select "Picture" from the Illustrations group:
Once we click the Picture icon, we are brought to a dialog where we can navigate to where our Pareto Chart was saved. Importantly, I will also select “Insert and Link” from the Insert drop down menu:

We are now finished. Microsoft Word is now connected to the source file, in this case, a Pareto chart. Every time we run the executable in Minitab, a new Pareto chart is created and saved. When we open our status report, we will see the most up-to-date Minitab graph! If you have more than one graph, just follow the above steps for all your graphs. Awesome!
And I'm happy to report there have been no more late pizzas for the family on Friday nights.