


Before cutting an expensive piece of granite for a countertop, a good carpenter will first confirm he has measured correctly. Acting on faulty measurements could be costly.
While no measurement system is perfect, we rely on such systems to quantify data that help us control quality and monitor changes in critical processes. So, how do you know whether the changes you see are valid and not just the product of a faulty measurement system? After all, if you can’t trust your measurement system, then you can’t trust the data it produces.Performing a Gage R&R study can help you to identify problems with your measurement system, enabling you to trust your data and to make data-driven decisions for process improvement.
What Can Gage R&R Do for Me?
Gage R&R studies can tell you if inconsistencies in your measurements are too large to ignore—this could be due to a faulty tool or inconsistent operation of a tool.
Reveal an inconsistent tool
Let’s look at an example to better understand how Gage R&R studies work.
Suppose a company wants to use a control chart to monitor the fill weights of cereal boxes. Before doing so, they conduct a Gage R&R study to determine if the system which measures the weight of each cereal box is producing precise measurements.
The best way to ensure that measurements are valid is to look at repeatability, or the variation of the measurements taken by the same operator for the same part. If we weigh the same cereal box under the same conditions a number of times, will we observe the same weight every time? Weighing the same box over and over again can show us how much variation exists in our measurement system.
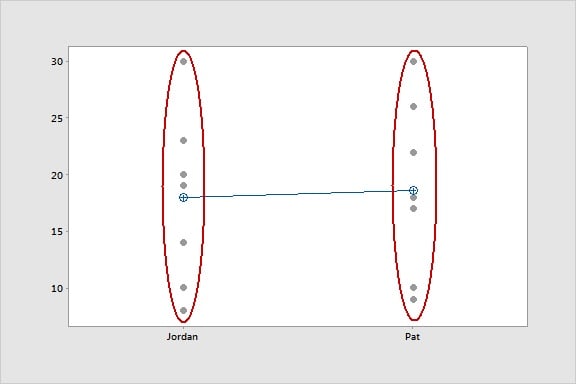
For this experiment, we can look at repeatability based on two different operators’ measurements. The Gage R&R results show that even when the same person weighs the same box on the same scale, the measurements can vary by several grams. Most likely, the scale is in serious need of recalibration. The faulty scale would have rendered a control chart for these measurements virtually useless. Although the average measurements for each operator are not far apart, the spread of the measurements is huge!
Highlight operator differences
But the variation that exists in the measurement system is just one aspect of a Gage R&R study. We must also look at reproducibility, or the variation due to different operators using the measurement system. A Gage R&R study can tell us whether a measurement differs from one operator to the next and by how much.
Suppose the same company who wishes to monitor fill weights of cereal boxes hires new employees to help record measurements. The company uses a Gage R&R to evaluate both the new operators and experienced operators.
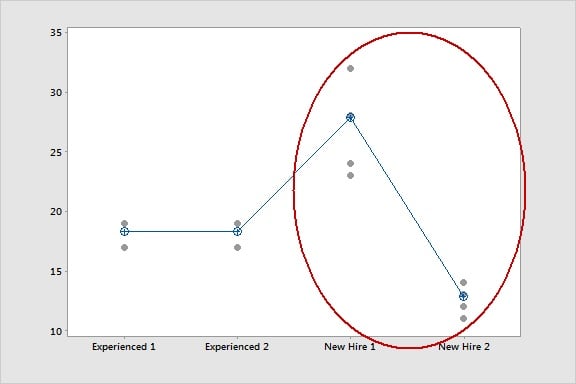
The study reveals that when employees weigh the same cereal box, the measurements of new hires are too high or too low more often than the measurements of experienced employees. This finding might indicate that the company should conduct more training for the new hires.
How to Analyze a Gage R&R Study in Minitab
Awareness of how well you can measure something can have substantial financial impacts. Minitab Statistical Software makes it easy to analyze how precise your measurements are.
In the case of the company evaluating cereal box fill weights, problems of over- and under-filling have different implications. Overfilling cereal boxes is costing the company money they could be saving with a calibrated measurement system and properly trained staff. Similarly, not filling cereal boxes fully is making customers angry because they didn’t get the amount of product they paid for.
Getting started
Preparing to analyze your measurement system is easy because Minitab’s Create Gage R&R Study Worksheet can generate a data collection sheet for you. The dialog box lets you quickly specify who takes the measurements (the operators), which item they measure (the parts), and in what order the data are to be collected.
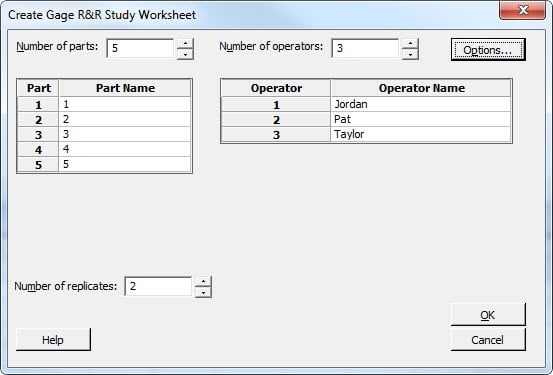
- Choose Stat > Quality Tools > Gage Study > Create Gage R&R Study Worksheet.
- Specify the number of parts, number of operators, and the number of times the same operator will measure the same part.
- Give descriptive names to the parts and operators so they’re easy to identify in the output.
- Click OK.
The main event
After you create your data collection sheet and record the measurements you observe, you can use Gage R&R Study (Crossed) to analyze the measurements.
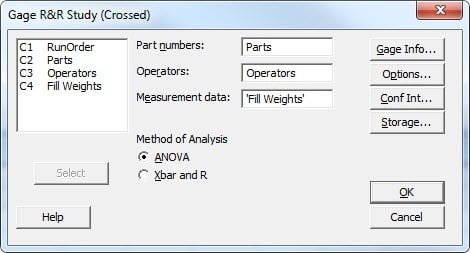
- Choose Stat > Quality Tools > Gage Study > Gage R&R Study (Crossed).
- In Part Numbers, enter Parts.
- In Operators, enter Operators.
- In Measurement Data, enter 'Fill Weights'.
- Click OK.
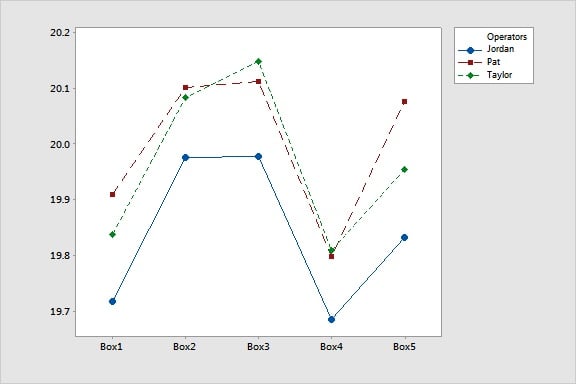
The study reveals that Jordan’s measurements are lower than Pat’s or Taylor’s. In fact, the %Study Variation for our total Gage R&R is high—90.39%—indicating that our measurement system is unacceptable. Identifying and eliminating the source of the difference will improve the measurement system.
Some of my colleagues offer more information on Gage R&R tools and how to interpret the output.
Putting Gage R&R Studies to Use
Taking measurements is like any other process—it’s prone to variability. Assessing and identifying where to focus efforts for reducing this variation with Minitab’s Gage R&R tools can help you ensure your measurement system is precise.