


I was recently asked a couple of questions about stability studies in Minitab.
Question 1: If you enter in a lower and upper spec in the Stability Study dialog window, why do I see only one confidence bound per fitted line on the resulting graph? Shouldn’t there be two?
You use a stability study to analyze the stability of a product over time and to determine the product's shelf life. In order to run this in Minitab, you need:
- Measurement Data
- Time Variable
- Batch Factor(Optional)
Shown below is a sample of the first 14 rows of a Stability Study data set. The full data set can be found in our Sample Data folder within Minitab Statistical Software, via Help > Sample Data in Minitab 17.3 and later versions. Search for and open the ShelfLife.mtw file. You can download a free 30-day trial of the software if you're not already using it.
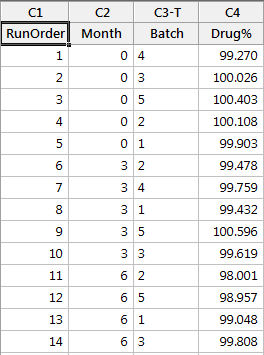
The Month column represents the month at which the age of the product was collected. The batch column represents where the product originated from. In the sixth row, for example, the drug concentration percentage for Batch 2 at 3 months was 99.478%.
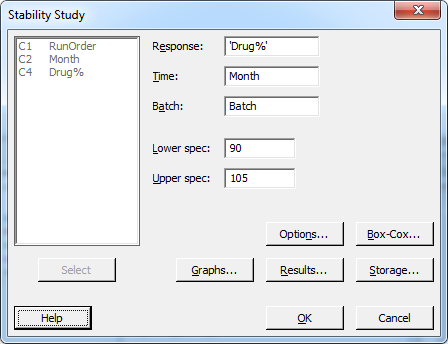
With this information, the stability study will help you estimate the average length of time that the response will be within specification. To satisfy my inquisitor’s first question, we will use a lower spec of 90% and an upper spec of 105%.
The Stability Study dialog box:
The Resulting Graph:
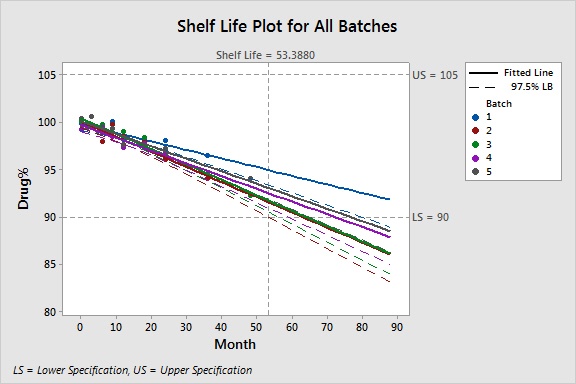
Minitab first checks to see if the starting point of the fitted line is between specs, and then determines the direction of the slope of the fitted lines before deciding what limit to calculate the shelf life from. If the decrease in the mean response is significant, then Minitab calculates the shelf life relative to the lower specification limit.
If the increase in the mean response over time is significant, Minitab calculates the shelf life relative to the upper specification limit. How we choose our bound is then decided by what spec Minitab has sided with. Thus, the 97.5% lower bound is only being shown in relation to the corresponding fitted line above it. From a conceptual standpoint, if the slope of the mean response line is trending downward, then you'd be looking at where its worst case scenario, the 97.5% lower bound, intersects with that lower spec. The overall shelf life for the batches is at 53.39 months for a 90% concentration.
Question 2: I get asterisks for Shelf Life at each Batch, as show below:
Batch Shelf Life
1 *
2 *
3 *
4 *
5 *
Overall *
This question is closely related to the first. This depends on the slope’s direction and what specification, lower or upper, you have chosen. Most likely, you won’t run into this situation if:
a. Your fitted line has a significant negative slope and you are only inputting a lower spec.
b. Your fitted line has a significant positive slope and you are only inputting an upper spec.
If you run a stability study with two specs, you may receive these asterisks if the mean response at time = 0 is not within both specifications. You can see this when we use a lower spec of 90 and an upper spec of 98:
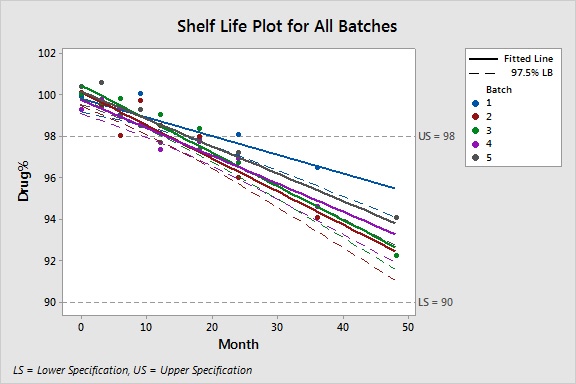
For all batches with negative slope, if the response starts out above the upper spec it could never potentially go out of spec in the future, at least based on this model's prediction. It can't calculate a shelf-life for those batches.
It’s a different story in the first question we discussed (and first graph we showed), as the mean response at time = 0 was below the upper spec.
On a side note, there is another situation which can cause you to obtain all asterisks for the shelf life of the batches. This will happen when the slopes of all fitted lines on the graph are simply not significant.
I hope this information helps you when you perform your next stability study!