


Design of Experiments (DOE) is the perfect tool to efficiently determine if key inputs are related to key outputs. Behind the scenes, DOE is simply a regression analysis. What’s not simple, however, is all of the choices you have to make when planning your experiment. What X’s should you test? What ranges should you select for your X’s? How many replicates should you use? Do you need center points? Etc. So let’s talk about center points.
What Are Center Points?
Center points are simply experimental runs where your X’s are set halfway between (i.e., in the center of) the low and high settings. For example, suppose your DOE includes these X’s:
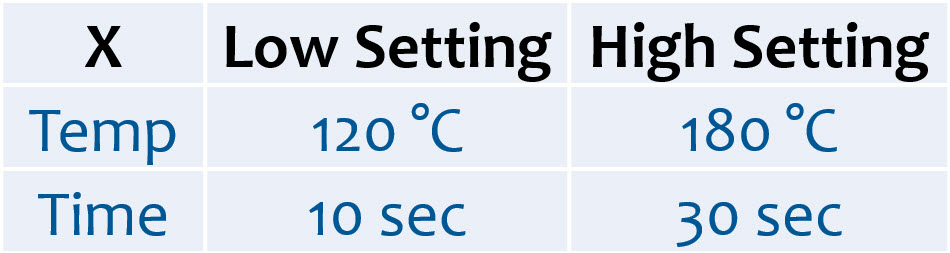
The center point would then be set midway at a Temperature of 150 °C and a Time of 20 seconds.
And your data collection plan in Minitab Statistical Software might look something like this, with the center points shown in blue:
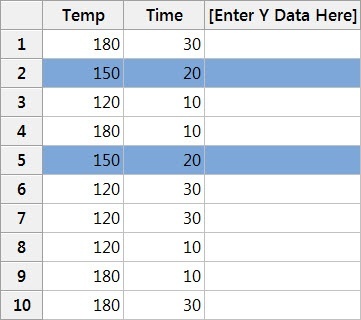
You can have just 1 center point, or you can collect data at the center point multiple times. This particular design includes 2 experimental runs at the center point. Why pick 2, you may be asking? We’ll talk about that in just a moment.
Why Should You Use Center Points in Your Designed Experiment?
Including center points in a DOE offers many advantages:
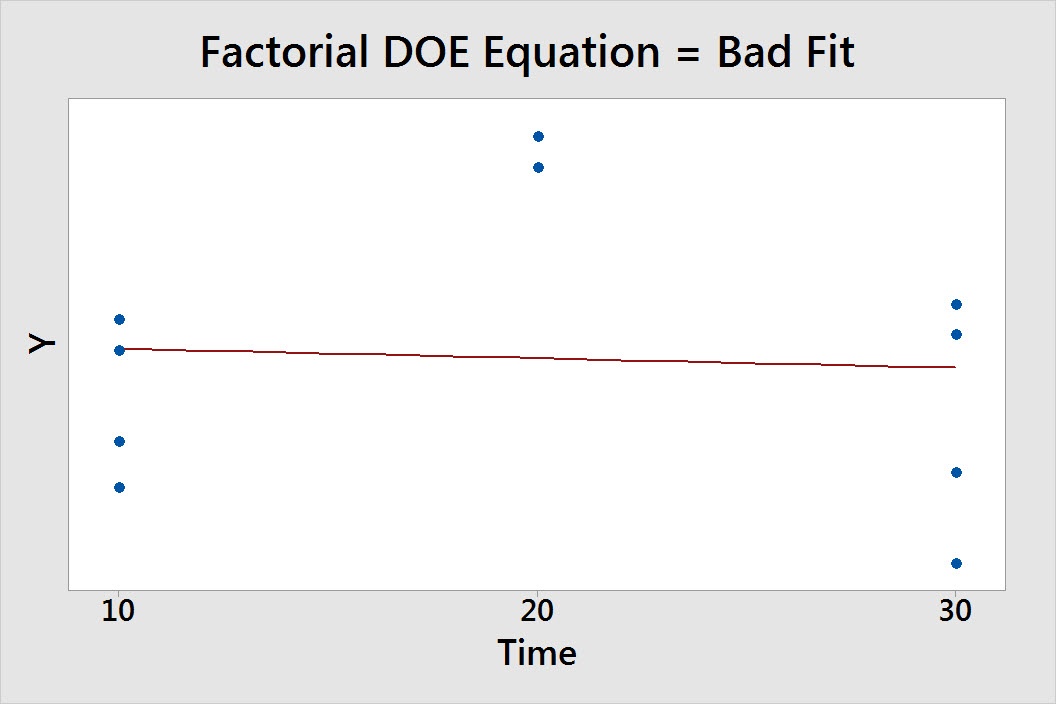
1. Is Y versus X linear?
Factorial designs assume there’s a linear relationship between each X and Y. Therefore, if the relationship between any X and Y exhibits curvature, you shouldn’t use a factorial design because the results may mislead you.
So how do you statistically determine if the relationship is linear or not? With center points! If the center point p-value is significant (i.e., less than alpha), then you can conclude that curvature exists and use response surface DOE—such as a central composite design—to analyze your data. While factorial designs can detect curvature, you have to use a response surface design to model (build an equation for) the curvature.
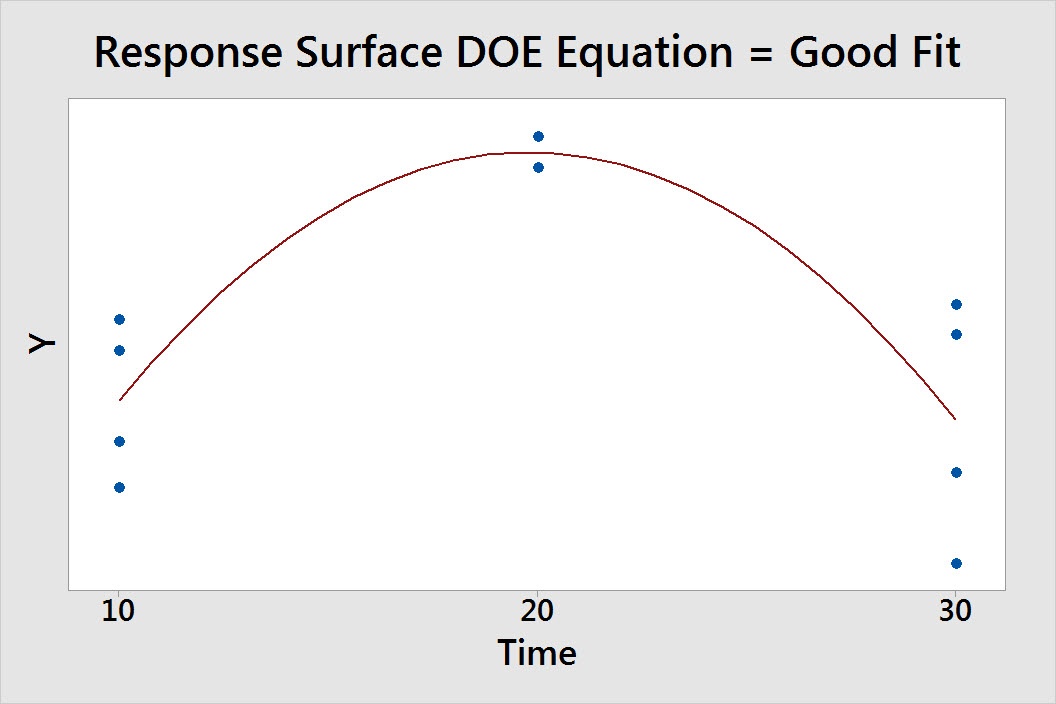
And the good news is that curvature often indicates that your X settings are near an optimum Y, and you've discovered insightful results!
2. Did you collect enough data?
If you don’t collect enough data, you aren’t going to detect significant X’s even if they truly exist. One way to increase the number of data points in a DOE is to use replicates. However, replicating an entire DOE can be expensive and time-consuming. For example, if you have 3 X’s and want to replicate the design, then you have to increase the number of experimental runs from 8 to 16!
Fortunately, using replicates is just one way to increase power. An alternative way to increase power is to use center points. By adding just a few center points to your design, you can increase the probability of detecting significant X’s, and estimate the variability (or pure error, statistically speaking).
Learn More about DOE
DOE is a great tool. It tells you a lot about your inputs and outputs and can help you optimize process settings. But it’s only a great tool if you use it the right way. If you want to learn more about DOE, check out our e-learning course Quality Trainer for $30 US. Or, you can participate in a full-day Factorial Designs course at one of our instructor-led training sessions.