


Back when I used to work in Minitab Tech Support, customers often asked me, “What’s the difference between Cpk and Ppk?” It’s a good question, especially since many practitioners default to using Cpk while overlooking Ppk altogether. It’s like the '80s pop duo Wham!, where Cpk is George Michael and Ppk is that other guy.
Poofy hairdos styled with mousse, shoulder pads, and leg warmers aside, let’s start by defining rational subgroups and then explore the difference between Cpk and Ppk.
Rational Subgroups
A rational subgroup is a group of measurements produced under the same set of conditions. Subgroups are meant to represent a snapshot of your process. Therefore, the measurements that make up a subgroup should be taken from a similar point in time. For example, if you sample 5 items every hour, your subgroup size would be 5.
Formulas, Definitions, Etc.
The goal of capability analysis is to ensure that a process is capable of meeting customer specifications, and we use capability statistics such as Cpk and Ppk to make that assessment. If we look at the formulas for Cpk and Ppk for normal (distribution) process capability, we can see they are nearly identical:
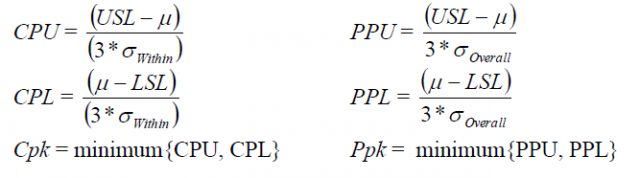
The only difference lies in the denominator for the Upper and Lower statistics: Cpk is calculated using the WITHIN standard deviation, while Ppk uses the OVERALL standard deviation. Without boring you with the details surrounding the formulas for the standard deviations, think of the within standard deviation as the average of the subgroup standard deviations, while the overall standard deviation represents the variation of all the data. This means that:
Cpk:
- Only accounts for the variation WITHIN the subgroups
- Does not account for the shift and drift between subgroups
- Is sometimes referred to as the potential capability because it represents the potential your process has at producing parts within spec, presuming there is no variation between subgroups (i.e. over time)
Ppk:
- Accounts for the OVERALL variation of all measurements taken
- Theoretically includes both the variation within subgroups and also the shift and drift between them
- Is where you are at the end of the proverbial day
Examples of the Difference Between Cpk and Ppk
For illustration, let's consider a data set where 5 measurements were taken every day for 10 days.
Example 1 - Similar Cpk and Ppk
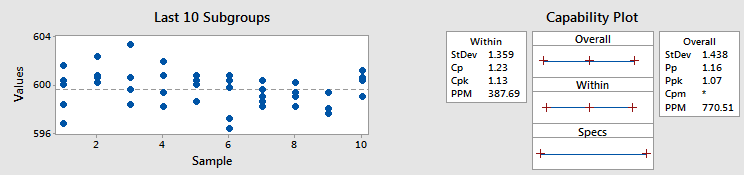
As the graph on the left side shows, there is not a lot of shift and drift between subgroups compared to the variation within the subgroups themselves. Therefore, the within and overall standard deviations are similar, which means Cpk and Ppk are similar, too (at 1.13 and 1.07, respectively).
Example 2 - Different Cpk and Ppk
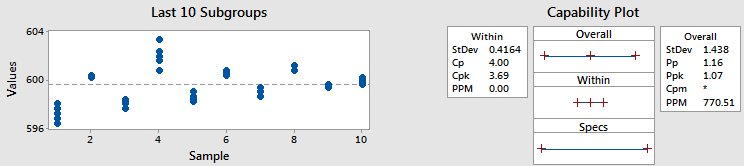
In this example, I used the same data and subgroup size, but I shifted the data around, moving it into different subgroups. (Of course we would never want to move data into different subgroups in practice – I’ve just done it here to illustrate a point.)
Since we used the same data, the overall standard deviation and Ppk did not change. But that’s where the similarities end.
Look at the Cpk statistic. It’s 3.69, which is much better than the 1.13 we got before. Looking at the subgroups plot, can you tell why Cpk increased? The graph shows that the points within each subgroup are much closer together than before. Earlier I mentioned that we can think of the within standard deviation as the average of the subgroup standard deviations. So less variability within each subgroup equals a smaller within standard deviation. And that gives us a higher Cpk.
To Ppk or Not to Ppk
And here is where the danger lies in only reporting Cpk and forgetting about Ppk like it’s George Michael’s lesser-known bandmate (no offense to whoever he may be). We can see from the examples above that Cpk only tells us part of the story, so the next time you examine process capability, consider both your Cpk and your Ppk. And if the process is stable with little variation over time, the two statistics should be about the same anyway.
(Note: It is possible, and okay, to get a Ppk that is larger than Cpk, especially with a subgroup size of 1, but I’ll leave explanation for another day.)