


In Parts 1 and 2 of this blog series, I wrote about how statistical inference uses data from a sample of individuals to reach conclusions about the whole population. That’s a very powerful tool, but you must check your assumptions when you make statistical inferences. Violating any of these assumptions can result in false positives or false negatives, thus invalidating your results.
The common data assumptions are: random samples, independence, normality, equal variance, stability, and that your measurement system is accurate and precise. I addressed random samples and statistical independence last time. Now let’s consider the assumptions of stability and measurement systems.
What Is the Assumption of Stability?
A stable process is one in which the inputs and conditions are consistent over time. When a process is stable, it is said to be “in control.” This means the sources of variation are consistent over time, and the process does not exhibit unpredictable variation. In contrast, if a process is unstable and changing over time, the sources of variation are inconsistent and unpredictable. As a result of the instability, you cannot be confident in your statistical test results.
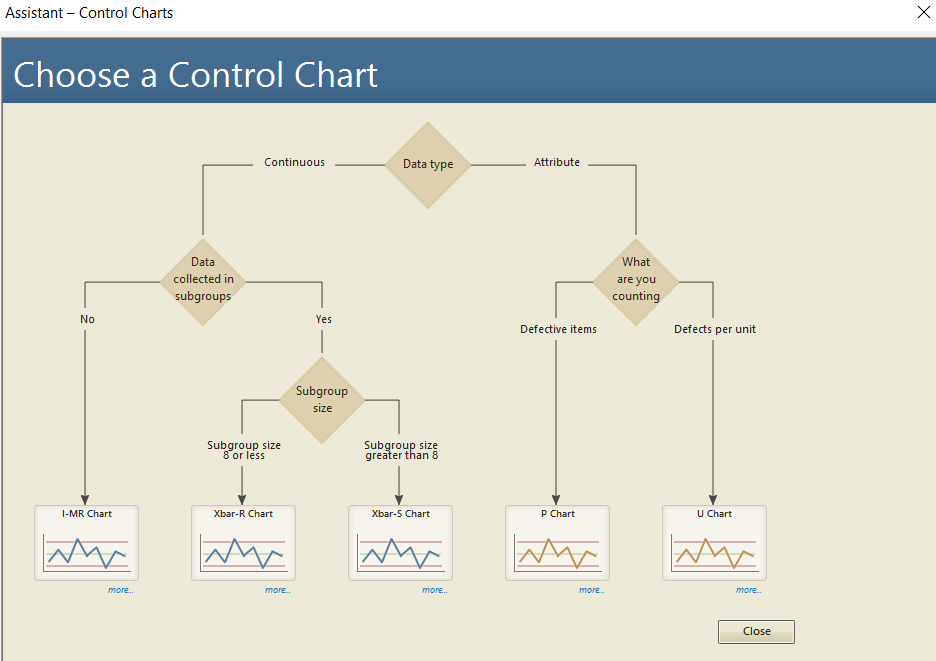
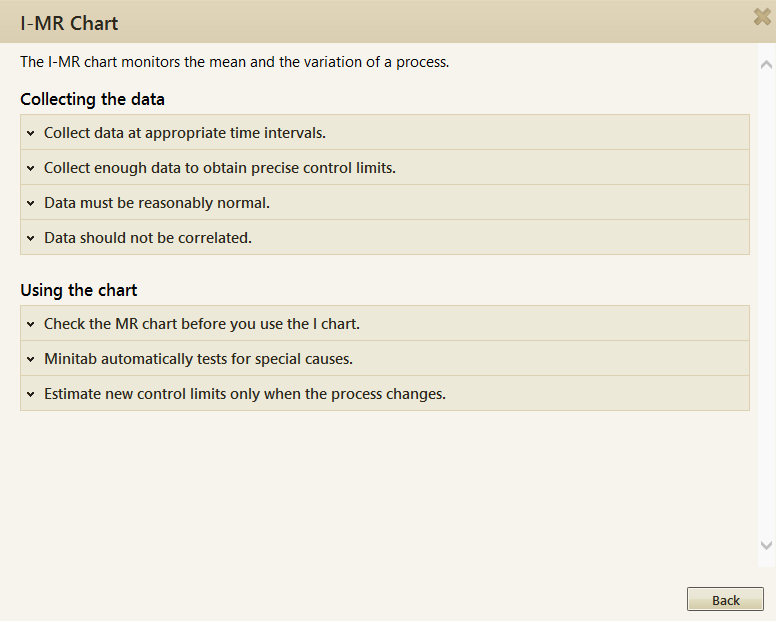
Use one of the various types of control charts available in Minitab Statistical Software to assess the stability of your data set. The Assistant menu can walk you through the choices to select the appropriate control chart based on your data and subgroup size. You can get advice about collecting and using data by clicking the “more” link.
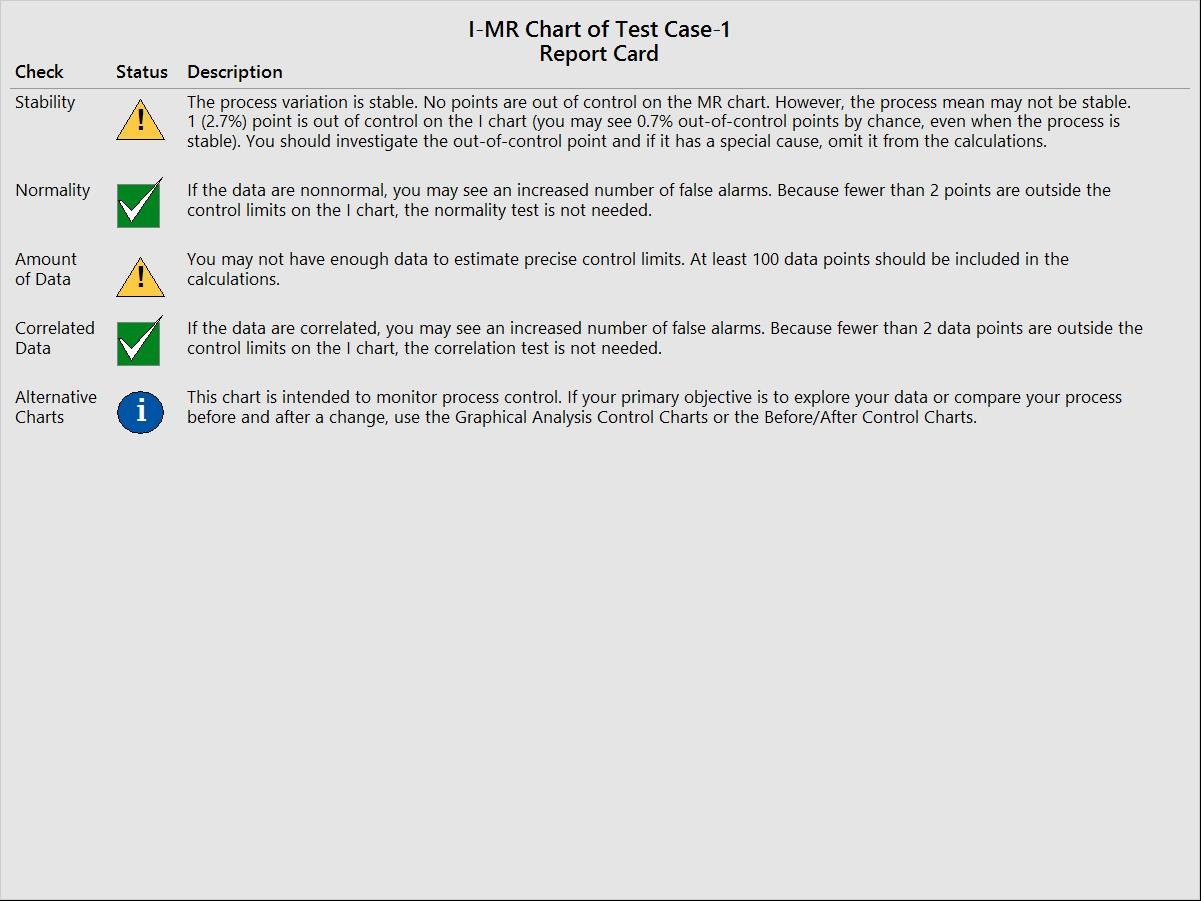
In addition to preparing the control chart, Minitab tests for out-of-control or non-random patterns based on the Nelson Rules and provides an assessment in easy-to-read Summary and Stability reports. The Report Card, depending on the control chart selected, will automatically check your assumptions of stability, normality, amount of data, correlation, and will suggest alternative charts to further analyze your data.
What Is the Assumption for Measurement Systems?
All the other assumptions I’ve described “assume” the data reflects reality. But does it?
The measurement system is one potential source of variability when measuring a product or process. When a measurement system is poor, you lose the ability to truthfully “see” process performance. A poor measurement system leads to incorrect conclusions and flawed implementation.
Minitab can perform a Gage R&R test for both measurement and appraisal data, depending on your measurement system. You can use the Assistant in Minitab to help you select the most appropriate test based on the type of measurement system you have.

There are two assumptions that should be satisfied when performing a Gage R&R for measurement data:
- The measurement device should be calibrated.
- The parts to be measured should be selected from a stable process and cover approximately 80% of the possible operating range.
When using a measurement device make sure it is properly calibrated and check for linearity, bias, and stability over time. The device should produce accurate measurements, compared to a standard value, through the entire range of measurements and throughout the life of the device. Many companies have a metrology or calibration department responsible for calibrating and maintaining gauges.
Both these assumptions must be satisfied. If they are not, you cannot be sure that your data accurately reflect reality. And that means you’ll risk not understanding the sources of variation that influence your process outcomes.
The Real Reason You Need to Check the Assumptions
Collecting and analyzing data requires a lot of time and effort on your part. After all the work you put into your analysis, you want to be able to reach correct conclusions. Some analyses are robust to departures from these assumptions, but take the safe route and check! You want to be confident you can tell whether observed differences between data samples are simply due to chance, or if the populations are indeed different!
It’s easy to put the cart before the horse and just plunge in to the data collection and analysis, but it’s much wiser to take the time to understand which data assumptions apply to the statistical tests you will be using, and plan accordingly.
Thank you for reading my blog. I hope this information helps you with your data analysis mission!