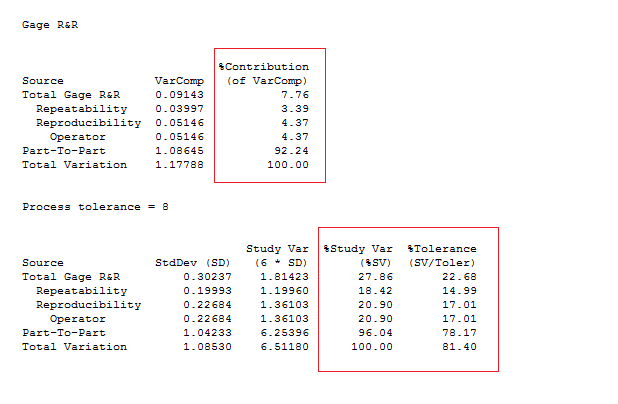
In my last post, I discussed what the "Number of Distinct Categories" means in gage R&R output . Another common question with Gage Crossed is what table to look at when assessing your measurement system. By default, Minitab gives a %Contribution table and %Study Variation table. Which one should you use when assessing where the variation is mostly coming from? Well, you could use either of them.
The %Contribution table can be convenient because all sources of variability add up nicely to 100%. Example:

The %Study Variation table doesn’t have the advantage of having all sources add up nicely to 100%, but it has other positive attributes. Because standard deviation is expressed in the same units as the process data, it can be used to form other metrics, such as Study Variation (6*standard deviation), %Tolerance (if you enter in specification limits for your process), and %Process (if you enter in an historical standard deviation). Of course, there are guidelines for levels of acceptability from AIAG as well:
If the Total Gage R&R contribution in the %Study Var column (% Tolerance, %Process) is:
- Less than 10% - the measurement system is acceptable.
- Between 10% and 30% - the measurement system is acceptable depending on the application, the cost of the measuring device, cost of repair, or other factors.
- Greater than 30% - the measurement system is unacceptable and should be improved.
If you are looking at the %Contribution column, the corresponding standards are:
- Less than 1% - the measurement system is acceptable.
- Between 1% and 9% - the measurement system is acceptable depending on the application, the cost of the measuring device, cost of repair, or other factors.
- Greater than 9% - the measurement system is unacceptable and should be improved.
We field a lot of questions about %Tolerance as well. %Tolerance is just comparing estimates of variation (part-to-part, and total gage) to the spread of the tolerance.
When you enter a tolerance, the output from your gage study will be exactly the same as if you hadn't entered a tolerance, with the exception that your output will now contain a %Tolerance column. Your results will still be accurate if you don't put in a tolerance range; however, including the tolerance will provide you more information.
For example, you could have a high percentage in %Study Var for part-to-part, and a high number of distinct categories. However, when you compare the variation to your tolerance, it might show that in reference to your spec limits, the variation due to gage is high. The %Tolerance column may be more important to you than the %Study Var column, since the %Tolerance is more specific to your product and its spec limits.
Think of it this way: Your total variation comprises part-to-part and the gage (Reproducibility and Repeatability). After adding a tolerance, we get to see what percentage of variation really dominates within the tolerance bounds specified. If the ratio between the Total Gage R&R and the tolerance is high (%Tolerance>30%), that provides insight about the types of parts being selected. It’s telling us that the measurement tool cannot effectively decipher if the part is good or bad, because too much measurement system variation is showing up between specifications.
I hope the answers to these common questions help you next time you’re doing Gage R&R in Minitab!


