


Many statistical analyses require an assumption of normality. In cases when your data are not normal, sometimes you can apply a function to make your data approximately normal so that you can complete your analysis.
If you've seen any of the Transformers movies, you know that these extraordinary robots can, with some Hollywood magic, turn themselves into apparently normal items like cars and appliances.
You may not get quite the same special-effects thrill, but when you have an extraordinary (i.e., non-normal) data set, Minitab Statistical Software can pull a Transformers-like metamorphosis on it.
In Minitab, you’ll find two tools that you can use to potentially transform your non-normal data into data that is normally distributed. Having normally distributed data is important when performing a normal capability analysis, so let’s check out where to find these transformations.
The Box-Cox Transformation
This transformation can be found in a few places:
- Stat > Control Charts > Box-Cox Transformation
- Stat > Quality Tools > Individual Distribution Identification
- Stat > Quality Tools > Capability Analysis/Sixpack > Normal…
In this scenario, Minitab simply applies a power transformation to your non-normal data set, but in a more optimal fashion. Minitab mathematically cycles through lambdas (the power values) until it finds a transformation suitable to test against normality. Here are some common lambdas for transformation:

Sidenote: The Box-Cox Transformation requires that all of the original data are greater than 0.
The Johnson Transformation
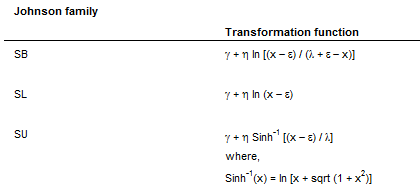
Box-Cox Transformation not for you because you've got items that are less than or equal to zero? Fortunately, the Johnson Transformation allows for values less than zero! Johnson differs from Box-Cox in that it tries to select a function from three different Johnson “families.” The selected function is then used to transform the original data into data that follows a normal distribution.
Here are the different families and their transformation functions.
This transformation can also be found in these places:
- Stat > Quality Tools > Individual Distribution Identification
- Stat > Quality Tools > Capability Analysis/Sixpack > Normal…(Under the submenu entitled Transform)
- Stat > Quality Tools > Johnson Transformation
Other Data Distributions
In some cases, you may find that these two transformation methods are unsuccessful in transforming your data into something suitable for passing the normality test. If you find yourself in this scenario, then you may want to consider seeing if the original data set follows a non-normal data distribution like the Weibull or exponential distribution. These can be found and tested under the Individual Distribution Identification under Quality Tools.
You may also want to consider performing other investigations in regards to the nature of the data, like seeing if there are overlapping distributions in the data, or if there are other special causes involved, etc.
I hope this review of transformations helps next time you look to assess normality or see if a process is capable!
Excerpt of Optimus Prime patent image in public domain.