


Want to learn some simple tricks for preparing your graphs for presentation—specifically, how to add footnotes to your graphs, display your graphs in one layout, and add objects (shapes, text, etc.) to make your graphs easier to interpret? Below I’ll share three tips that can help you get your Minitab graphs presentation-ready!
1. Add a footnote to a graph:
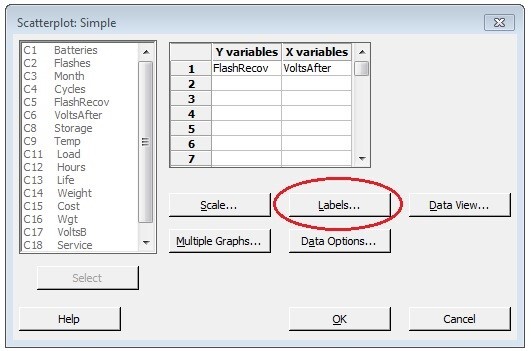
If you’re looking to add a footnote while you’re in the process of creating a graph, in the dialog box for the graph you are creating, click Labels:
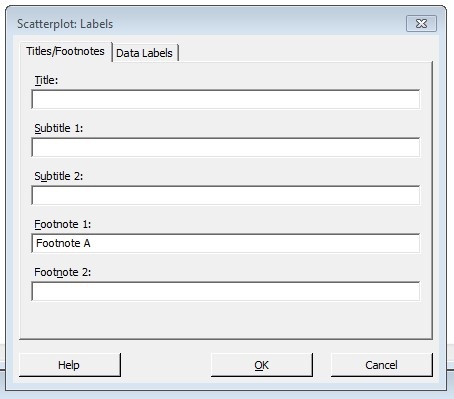
Then you can type your footnote (or modify your graph title and even add a subtitle):
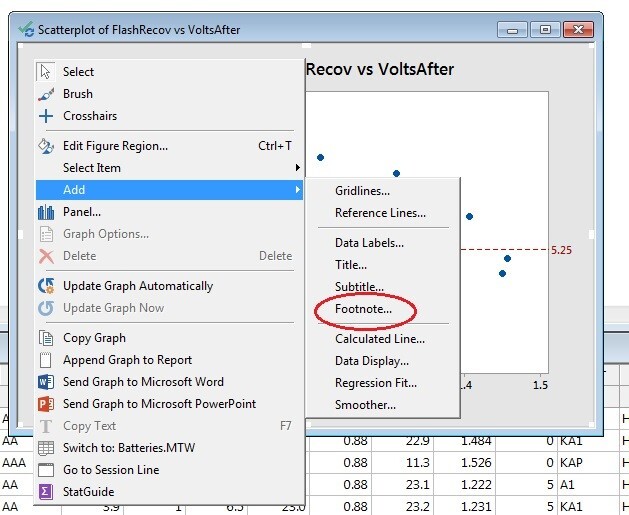
If you’ve already got your graph created and want to add a footnote, just make sure the existing graph is active, then choose Editor > Add:
Note that you can also change the text, font, size, color, or alignment of your footnote (or title or subtitle) by double-clicking it, and then you can move it by dragging and dropping it to a new location on your graph.
Bonus Tip! You can display the project name, worksheet name, date, time, or custom text (such as your company's name) automatically on all the graphs you create. Choose Tools > Options > Graphics > Annotation > My Footnote and select the items that you want to include.
2. Display your graphs together in one layout:
If you want to compare or contrast different graphs or perhaps emphasize a group of graphs for your report or presentation, then the graph layout options in Minitab are for you! Use this option to organize multiple graphs from the same project on one page. Here’s how to do it:
- With one of the graphs you want to include in the layout active, choose Editor > Layout Tool (the active graph is copied to the first cell in the layout):
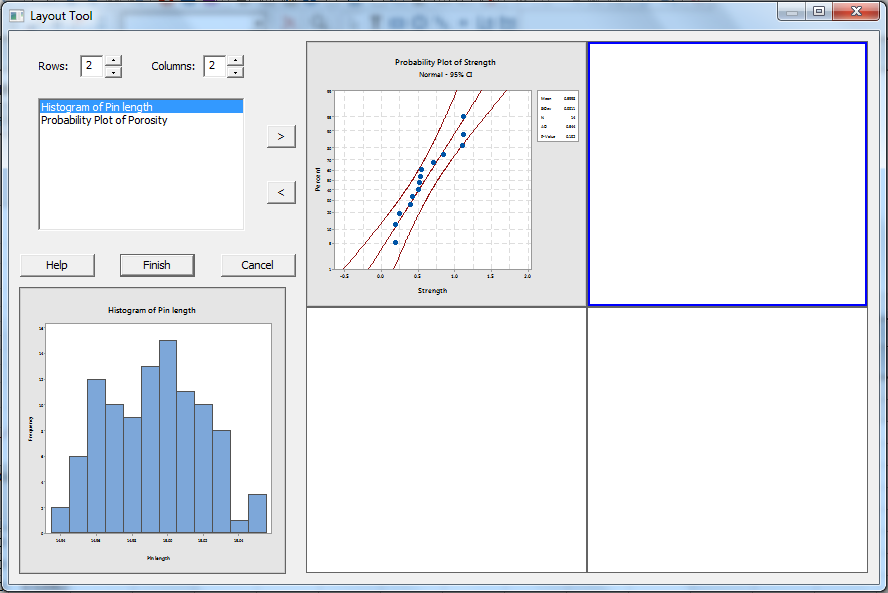
- In Rows, enter the number of rows for the layout.
- In Columns, enter the number of columns for the layout.
- To copy graphs to the layout, click the cell where you want to copy the graph and do one of the following:
- In the list box, double-click a graph name.
- In the list box, click a graph name and then click the right arrow button.
- Double-click the image of the selected item below the list box.
- Click Finish.
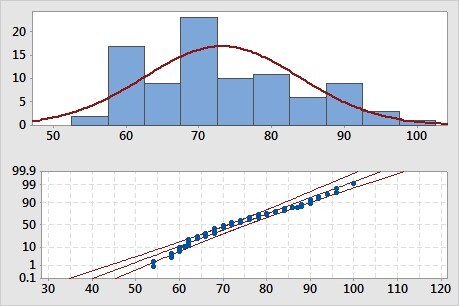
Here’s sample of a 2 rows by 1 column graph layout:
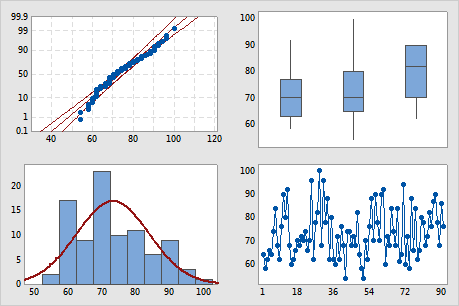
And here’s a sample of a 2 rows by 2 column graph layout:
3. Add a comment or text to describe your graph:
In the time series plot below, a rectangle, comment bubble, text and lines were added to show when a new product was released:
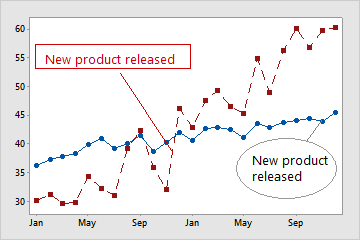
To do this in Minitab, use the Graph Annotation Tools toolbar:

With the graph active, click the item you’d like to add from the toolbar (text, a shape, marker symbols, etc.), and then click and drag on the graph to place item. To edit one the items you’ve already placed on the graph, select it and double-click it.
Looking for more tips for making your graphs presentation-worthy? Check out this topic on the Minitab Support site: Preparing your graphs for presentation