


I recently got a request from one of our Facebook fans to do a post about orthogonal regression, which I admit is not a subject I’m very familiar with. However, with a little help from Minitab’s help resources and by consulting a few Minitab experts, I think I came up with a post that will be useful. I thought it would help to discuss orthogonal regression with an example, but first...
What the Heck Is Orthogonal Regression?
Orthogonal regression is also known as “Deming regression” and examines the linear relationship between two continuous variables. It’s often used to test whether two instruments or methods are measuring the same thing, and is most commonly used in clinical chemistry to test the equivalence of instruments.
How Is Orthogonal Regression Different from Simple Regression?
Unlike simple linear regression, both the response and predictor in orthogonal regression contain measurement error. In simple regression, only the response variable contains measurement error.
An Example Using Orthogonal Regression
Suppose there is a medical equipment company that wants to determine if their blood pressure monitor is equivalent to a similar model on the market. The company obtains systolic blood pressure readings on a random sample of 60 people using the two instruments, and records the data in a Minitab worksheet:

Based on a previously conducted study, the company knows that the error variance ratio is 0.90.
However, note that the error variance ratio could be calculated by performing an independent Gage R&R study for each measurement device to produce a variance component (VarComp) for Repeatability for each device. The ratio of the two VarComp for Repeatability can be used as the input for the error variance ratio field.
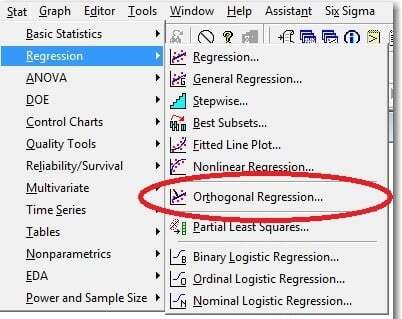
To perform the analysis, a quality practitioner at the company chooses Stat > Regression > Orthogonal Regression in Minitab:
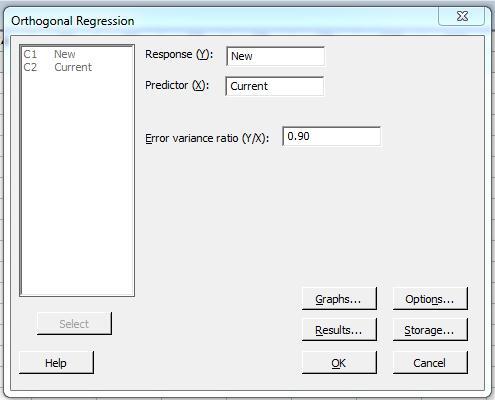
At the first dialogue box, he fills in the Response, Predictor, and error variance ratio. Then he clicks OK. :
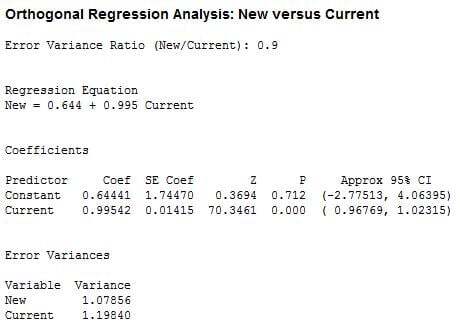
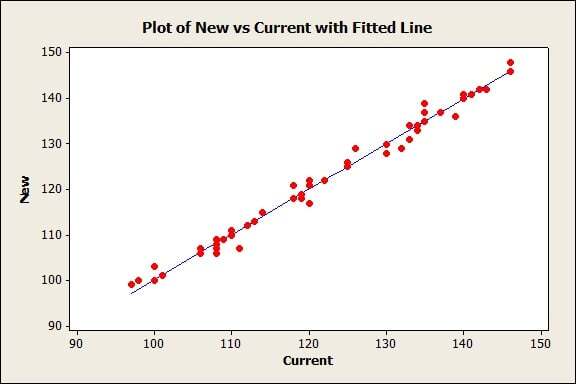
The quality practitioner is presented with the following session window output and line plot:
What Does this Orthogonal Regression Output Mean?
Because 0 is contained in the confidence interval for the intercept (-2.77513, 4.06395) and 1 is contained in the confidence interval for the slope (0.96769, 1.02315), there is no evidence that the two instruments measure different things. Essentially, the analysis is saying that the company’s blood pressure monitor readings are equivalent to readings from the similar model.
And remember that in orthogonal regression, the following assumptions must be met:
- Both the predictor and the response contain a fixed unknown quantity denoted as X and Y, respectively, and an error component.
- The error terms are independent.
- The error terms have means of zero and constant variances.
- The predictor and response are linearly related.
Hope this post was helpful!
Do you have any tips for performing orthogonal regression?