


My husband, Sean, and I were recently at my parent’s house for a picnic dinner. As a lover of hot sauce (I’m talking extremely hot, hot, hot, HOT sauce!), my stepdad always has a plethora of bottles around to try. While I do enjoy spicy foods from time to time, I’ve learned not to touch his hot sauce selections. His favorites are much too spicy for my taste!
Unfortunately, Sean learned the hard way. He used Habanero hot sauce on his hot sausage sandwich – talk about double the heat! I saw him sinking in his seat, eyes watering … a few hoarse coughs …
Yikes! Anyway, Sean is alive and well after suffering for a few uncomfortable minutes. His recent hot sauce hardship got me thinking more what makes hot sauce “hot” and how the heat is measured.
Visualizing the Relative Spiciness of Hot Peppers
The Scoville Heat Scale is a measure of the hotness of a chili pepper, the main ingredient in hot sauce. The scale is actually a measure of the concentration of the chemical compound called capsaicin, which creates that “my-mouth-is-on-fire” feeling. Different types of chili peppers contain various amounts of capsaicin, and the Scoville scale provides us with a measure of the heat of a chili pepper depending on the level of capsaicin it contains.
The heat values are measured on a scale of 0, which would be a sweet bell pepper with no spiciness, to upwards of well over a million Scoville heat units, which are chili peppers with the highest heat ratings. Check out this bar chart (In Minitab, navigate to Graph > Bar Chart) with a few of the hottest recorded chili peppers (based on the chart in this article):
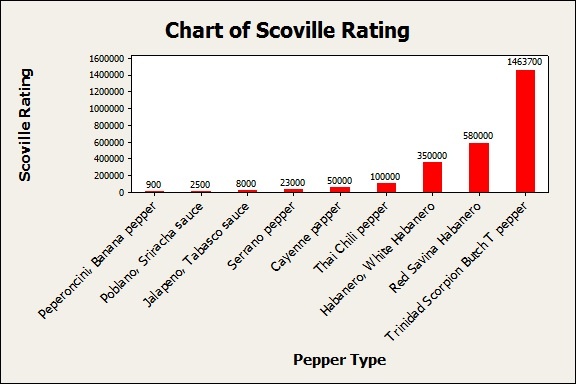
Keep in mind the variability of ratings, which can change based on different species of chilies, and variable growing conditions. The chart above is just an interpretation for the sake of comparing the different kinds of chilies out there and their approximate heat levels.
Do Your Ratings of Different Hot Sauces Match Mine?
For a little bit of fun, I wanted to see whether Sean and I rate the same hot sauces based on their “heat” levels consistently. That way, at least from my perspective, I can tell if he’s just a big baby who can’t take the heat, or if I’m the one with the spicy intolerance. But perhaps, we’ll rate the hot sauces the same? Let’s just find out.
We picked up a sampler of 10 different hot sauces to test. We each rated the 10 different sauces on a 4-point scale: 1 = mild, 2 = hot, 3 = very hot, 4 = uncomfortably hot, and recorded our data into a Minitab Worksheet:
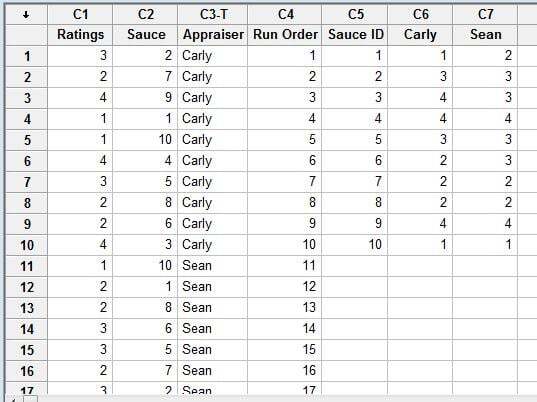
(You can download the dataset and follow along if you’d like.)
Performing an Attribute Agreement Analysis
What we want to do in this case is evaluate the ordinal measurement “rating” system for the hot sauce samples by performing an attribute agreement analysis in Minitab.
This type of analysis can be especially useful in the quality improvement world. For example, attribute agreement analysis helps assess the agreement of subjective ratings or classifications given by multiple appraisers. Using this analysis, you can assess if operators in your factory are agreeing on the pass/fail ratings for product samples.
In Minitab, choose Stat > Quality Tools > Attribute Agreement Analysis:
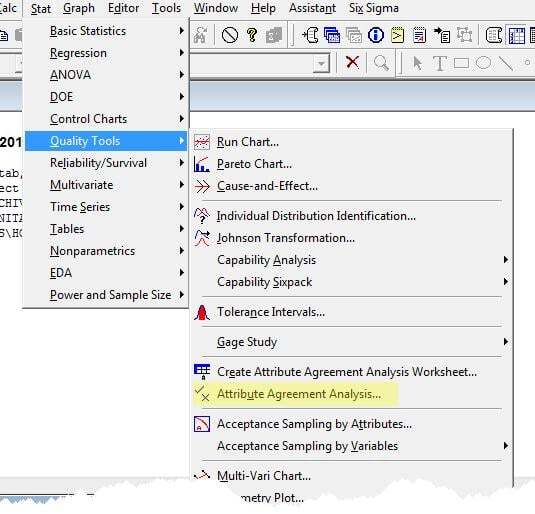
In the Attribute column, enter Ratings, in the Samples column, enter Sauce, and in Appraisers, enter Appraiser. Also, be sure to check the box at the bottom of the window for “Categories of attribute data are ordered.” Here’s the Minitab output:
How to Interpret the Results of the Attribute Agreement Analysis
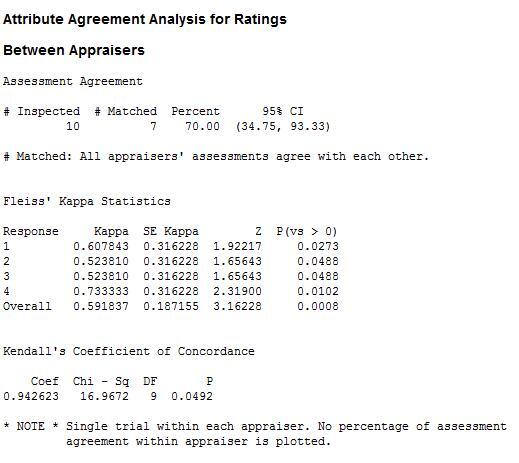
According to the ‘Between Appraisers’ table above, Sean and I agree on the rating for 7 of the 10 hot sauces. Not bad! I hear that after a while married people tend to look alike, but I guess they tend to “rate” alike too …
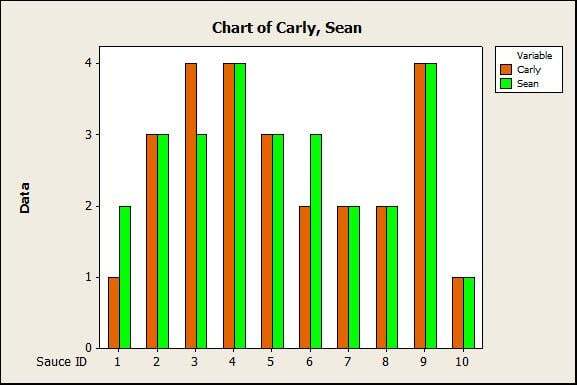
The p-value for the overall Kappa value is very low indicating that our agreement is not by chance. The p-value for Kendall’s coefficient of concordance is less than .05 (the typically used value of alpha), which indicates that the ratings between appraisers are associated. Kendall’s coefficient of concordance takes into account the ordinal nature of the data. The Minitab bar chart of ratings versus sauce grouped by appraiser below shows the 3 times that Sean and I didn’t match in our ratings. And those ratings were only apart by 1 unit, with the only disagreements happening on sauces 1, 3, and 6:
For more on attribute agreement analysis, check out the several tutorials available within Minitab Help (Help > Tutorials > Measurement Systems Analysis > Attribute Agreement Analysis, and in the StatGuide: Help > StatGuide > Quality Tools > Attribute Agreement Analysis).