


Tickets to attend the Super Bowl are among the most coveted sports tickets in the world, and the high average price for even nose-bleed seats illustrates how low supply and high demand can result in astronomical ticket pricing.
After last year’s Super Bowl, the Bleacher Report published an article that ranked the average ticket price of every Super Bowl since 1966. Can you believe that the average cost for a ticket 1966 was only $12.00? The pricing for the 2013 Super Bowl tickets range from $800 - $1,200, which is right on par with last year’s average cost.
Let’s take a look at the ticket price data in Minitab and see how we can use trend analysis to predict future ticket prices.
How have ticket prices changed over the years?
For the sake of simplicity, let’s focus on the average ticket prices for Super Bowls from 1985-2006. To view a simple snapshot of how the ticket prices have changed over the years, a time series plot clearly illustrates a steady increase in the ticket cost over time:
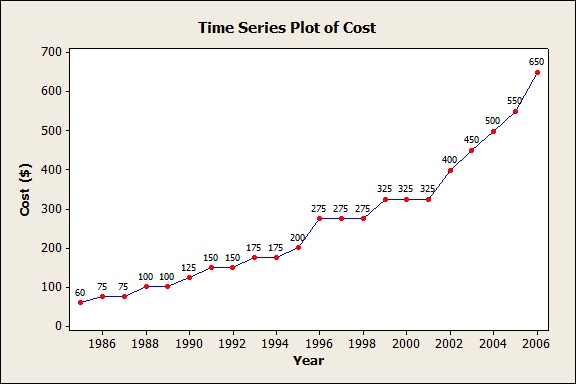
(To graph your data using a time series plot in Minitab, choose Graph > Time Series Plot.)
Forecasting Future Ticket Costs with Trend Analysis
Say we want to forecast future Super Bowl ticket prices based on the time series data we already have. In Minitab, we can perform a trend analysis (Stat > Time Series > Trend Analysis) to help us forecast.
What the heck is trend analysis, anyway? Trend analysis fits a general trend model to time series data and provides forecast projections. In Minitab, you can choose among the linear, quadratic, exponential growth or decay, and S-curve models to find the best fit for your data.
Since we have data from 1985-2006, let’s use trend analysis and a growth curve model to forecast ticket prices from 2007-2012:
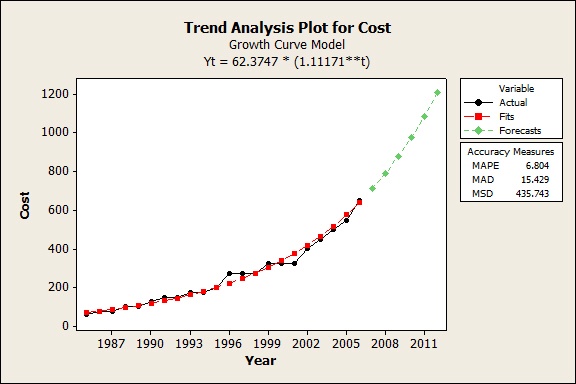
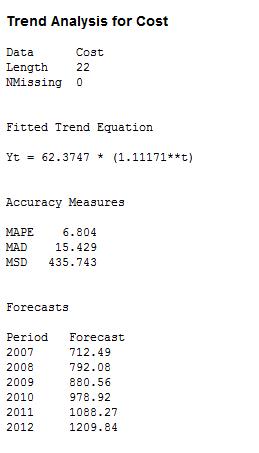
The trend plot shows the original data, the fitted trend line, and forecasts. The trend model (in red) fits well to the current data (in black), revealing a general upward trend in ticket pricing. The Minitab graph and output below displays the fitted trend equation, as well as the three accuracy measures to help you determine the accuracy of the fitted values (MAPE, MAD, and MSD).
Take a look at how the real average prices for 2007-2012 stack up against the forecasted prices:
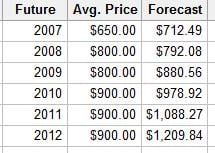
Pretty close! Even though we already knew the average prices for the years we forecasted, this example illustrates that trend analysis can be pretty darn good at providing accurate forecasts for time periods in the short-term future. Plus, trend analysis is the closest any of us will probably get to playing the role of fortune teller!
Many thanks to fellow Minitab blogger Eduardo Santiago for sharing his Minitab project with me, and then allowing me to share it with you! The data and the Minitab worksheet can be downloaded here.
How much would you pay for a ticket to the Super Bowl?