


In England, with only a few months left, the Barclay’s Premier League is about to enter the final run in to finish up the season. While the top two spots seem pretty locked up with Chelsea and Manchester City showing their class, the fight for the other two spots in the coveted top 4 promises to entertain to the very last weekend. This is key, because only the top 4 finishers qualify for next season's UEFA Champions Leagues.
Right now, there are five teams who have a realistic chance at qualifying for the last two Champions League spots: Manchester United, Southampton, Arsenal, Tottenham, and Liverpool.We’re going to use Minitab’s Prediction dialog to forecast, based on some statistics, who will finish top 4 and qualify for next season’s UEFA Champions League. Using our statistical software, we ran a regression using data from the past five seasons, with Total Points as our response variable (in the Premier League, you receive 3 points for every win, and 1 point for every draw). Our predictors included a few different team-based statistics, namely Shots per game; Possession, which tracks the percentage of time a team controls the ball, pass completion percentage; and goal difference.
After running the data through the Stat > Regression > Regression > Fit Regression Model command in Minitab, we arrived at the following final model:
Points = 45.39 - 0.157 Shots per game + 0.115 Possession + 0.040 Pass % + 0.5945 Goal Difference
Now, using the Predict dialog in the regression menu, we can forecast and see which of the five teams competing for a Champions League spot will come out on top, based on our model.
To do this, after we have fit a regression model like we did above, we go back to Stat > Regression > Regression > Predict.
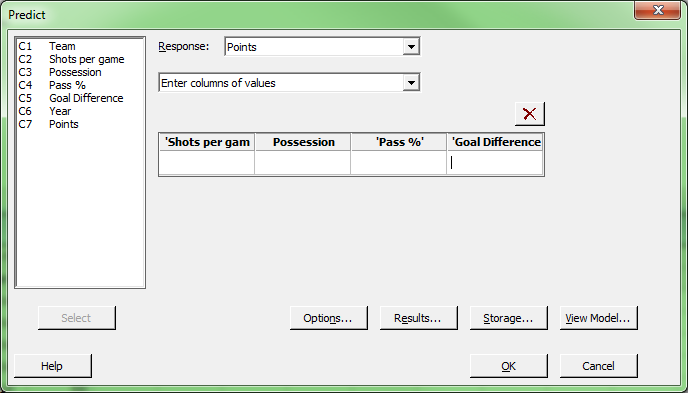
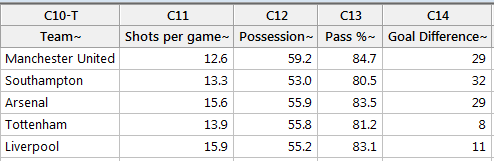
Here we are presented with a straightforward dialog that allows us to enter either individual values to predict on, or we can enter a column of values if we are interested in multiple predictions. For this analysis, we’re going to enter a column. Our worksheet contains the following table, which includes the statistics for each of our five teams, as well as a prorated goal differential, which will be used to forecast each team’s point total at the end of the year.
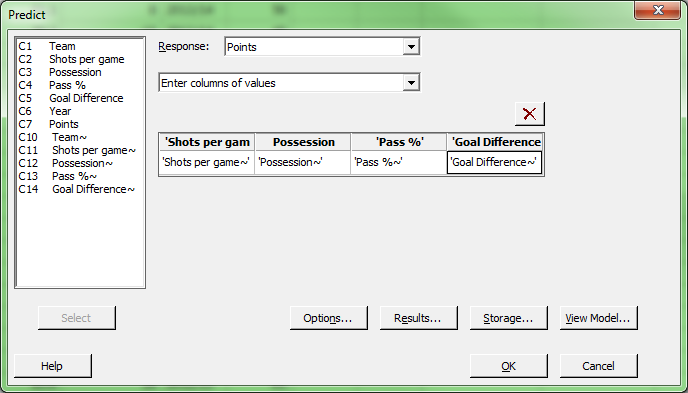
If we then go to Stat > Regression > Regression > Predict, we can fill out the dialog as follows, with our new columns. :
Before pressing "OK," click "Results" and make sure Prediction Table is checked. We can check our Session Window output to see predicted values for Total Points:
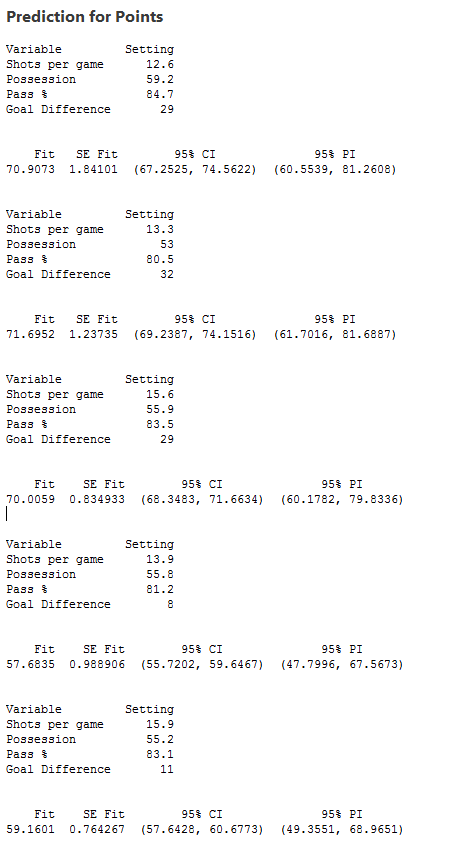
So what do our results tell us? Which of these five teams will finish in the Top 4? We can look at the raw point totals for each of the teams, which is listed under "Fit." Judging by these, we can rank the teams as follows, by point total:
Arsenal - 72
Manchester United - 71
Southampton - 70
Liverpool - 59
Tottenham - 57
According to our prediction, both Arsenal and Manchester United will qualify, with Southampton just on the outside looking in. Liverpool and Tottenham seem well behind according to our prediction. This makes sense, as the most important predictor in our model is goal difference, and those two teams are well behind the other three. Only time will tell if our predictions are correct, but for now, we'll pick Arsenal and Manchester United.