


It's your first day at the Jedi Temple, working as a lightsaber manufacturer. Your first task on the job is to run a Capability Analysis on the length of lightsabers being produced. Your main concern is to see if the lightsabers fit within the required length specifications set forth by the Jedi Council. You aren’t quite sure where to start. Thankfully, Minitab Statistical Software is there to help you—even in a galaxy far, far away.
Capability Analysis is used to assess the capability of an in-control process. A "capable" process is able to produce products or services that meet specifications.
Setting Up the Data for Capability Analysis
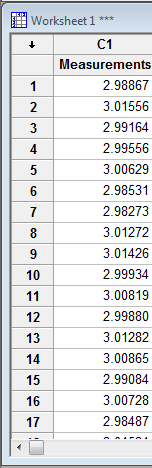
The first step in performing a Capability Analysis in Minitab is to make sure you have your data set up properly. The first piece of this setting up your measurement data in one column of a Minitab worksheet. In our case, the Jedi Council has provided us with 80 measurements taken from newly crafted lightsabers, taken over the course of 10 days. These measurements can be entered directly into Minitab, or imported from Microsoft Excel or even a SQL database. (If you’re wondering how we can get measurements so precise, well...being able to measure using the Force helps!)
Here's what our measurement column looks like in Minitab:
Identifying Subgroups for Capability Analysis
An important step in Capability Analysis is identifying your subgroups. A subgroup is simply a group of units produced under the same set of conditions. Ideally, it is a set of measurements taken close together in time, yet still independent of each other. In our case, the lightsabers were measured by a different Jedi each day for 10 days, with 8 sabers being measured by each. In quality terms, we have 10 subgroups, with 8 units in each subgroup.
In my experience working with Tech Support, many callers who are struggling with a Capability Analysis aren’t familiar with the concept of subgroup size, and thus gloss over it quickly. Don’t! The way you collected your data is extremely important to Capability Analysis.
Why Data Order Matters in Capability Analysis
You should always make sure your data is entered in Minitab in the order it was collected, and that each entry is assigned in the proper subgroup. Calculations essential to the analysis depend on the order of your data, as well as the size of these groups. For this reason, you should not sort your data.
To see why this is an issue, consider the following scenario: You have a subgroup of 5 measurements, one with sorted data, and one with unsorted data. If you sort the data, the analysis of the measurements will appear to display less variation than that subgroup actually had. As a result, your Cpk and other values will be artificially inflated, making your process look much more capable than it actually is. It is important to not fall into this trap.
I’ve also seen done people enter in a variety of subgroup sizes and choose the one that gives them the best Cpk, or parameter of interest. Needless to say, that's not appropriate—it isn’t correct to analyze your data with subgroups of 5 if, in reality, the subgroup size was 8.
Creating a Subgroup Column
Once we are sure of the subgroup size and that our data is entered in Minitab in the correct order, we can create a subgroup column. This will tell Minitab that the corresponding measurement belongs to a particular subgroup. Since our data is ordered, we know that the first 8 observations in our worksheet are a part of subgroup one, the next 8 are from subgroup 2, etc.
Creating a subgroup column in Minitab is fairly simple. We can do this by going to Calc > Make Patterned Data > Simple Set of Numbers. In our case, the dialog box would get filled out like this:
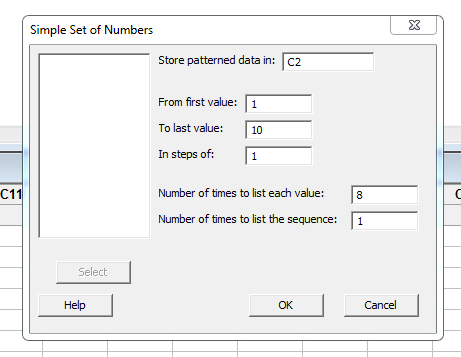
When we press OK in this dialog box, Minitab will create a string of numbers from 1 to 10, which represent the days our data was collected. The way we've filled out the dialog box also tells Minitab to display each value 8 times, which represents the 8 measurements taken each day, forming our subgroups.
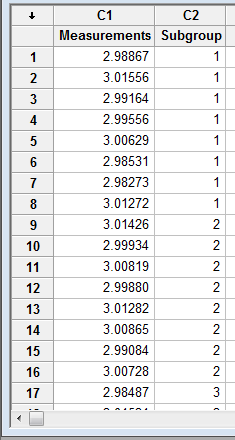
Once we have our subgroup column, our data set in Minitab’s worksheet should look as follows:
Now that we have our data set up in Minitab correctly and our subgroups correctly identified, we're nearly ready to do our analysis. My next post will go over meeting certain assumptions for capability analysis results to be valid, assumptions that need to be met before we start. Even the will of the force can only be trusted when it's backed up by sound statistical techniques. Okay, so that quote didn't quite make it to the final film, but it's true nonetheless!