


When you run a regression in Minitab, you receive a huge batch of output, and often it can be hard to know where to start. A lot of times, we get overwhelmed and just go straight to p-values, ignoring a lot of valuable information in the process. This post will give you an introduction to one of the other statistics Minitab displays for you, the VIF, or Variance Inflation Factor.
To start, let's look at what the VIF tells us. It's essentially a way to measure the effect of multicollinearity among your predictors. What is multicollinearity? It's simply a term used to describe when two or more predictors in your regression are highly correlated.
The VIF measures how much the variance of an estimated regression coefficient increases if your predictors are correlated. More variation is bad news; we're looking for precise estimates. If the variance of the coefficients increases, our model isn't going to be as reliable.
So how are the VIF values calculated? Let's take a look at Minitab Help's regression example to see how it's done.
Each predictor in your model will have a VIF value. In our case, we have a response that is measuring the total heat flux from solar energy powered homes, being predicted by the position of the focal points in 3 different directions, East, South, and North. We can run a regular regression, and get the following Minitab regression output:
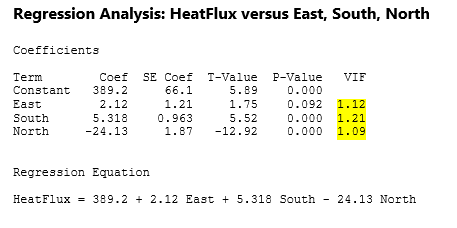
So how are the VIFs calculated? Essentially, we take the predictor in question, and regress it against all of the other predictors in our model. If you have your columns in Minitab, you can simply go to Stat > Regression > Regression > Fit Regression Model. In the Response field, enter the predictor in question. In our case, we'll choose South. In the continuous predictors field, you can enter the other predictors in the model, East and North for us here. Then, we simply run the regression.
We need one key piece of output from this regression, and that's the R-Sq value:
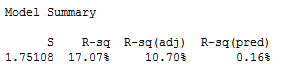
In this case, the R-sq value is .1707. Then we use the following formula to calculate:
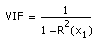
By the formula, 1/(1-.1707) = 1.21, our VIF.
If you take the square root of the variance inflation factor, that value tells you how much larger the standard error is compared to if that predictor was uncorrelated with any other predictor.
So in our case, for the South factor, the standard error of the factor is SqRt(1.21)=1.1 times as large as if the predictor was uncorrelated with any in the model, which is not a significant change. A VIF around 1 is very good.
There are some guidelines we can use to determine whether our VIFs are in an acceptable range. A rule of thumb commonly used in practice is if a VIF is > 10, you have high multicollinearity. In our case, with values around 1, we are in good shape, and can proceed with our regression.