


In my last blog, we looked at how a single data entry error can cruelly sabotage your statistical analysis.
And if that doesn't scare you silly, maybe this will.
The frequency of data entry errors can be as high as 27%, even when using the conservative "double-entry" method to record each data value twice.
So what can you do? Besides make offerings to appease Ate, the ancient Greek goddess of delusion, folly, and reckless errors?
First, some old-school advice. There’s no substitute for taking a deep breath, rolling up your sleeves, and double-checking every observation in your data.
But suppose you don't have the time or the intestinal fortitude for that?
Here are three simple ways to use Minitab to quickly spot big bloopers in your data to make sure they don't botch your analysis.
1 Perform Graphical Summary
If you have measurement (continuous) data, make it a habit—no, make it a strict religious ritual—to perform Graphical Summary before you run an analysis. Choose Stat > Basic Statistics > Graphical Summary.
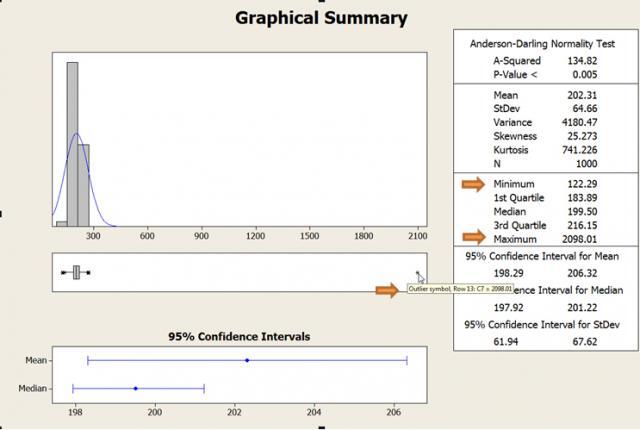
Look at the minimum and maximum values to make sure they're feasible. The boxplot shows any outliers in your data with an asterisk. Hold your cursor over the asterisk to identify the data value and its row in the worksheet. Then investigate to determine whether it's an error. If so, correct it or remove it before analyzing the data.
In this example, which shows total cholesterol values, Minitab flags 2098 as an outlier. Notice how the histogram gets squished to one side because that one value is out of whack.
For more on using Graphical Summary, click here.
2 Run Tally
If you have categorical data, such as text values in a column, then Tally is your ally. Use Stat > Tables> Tally Individual Variables to summarize all the discrete values in a column.
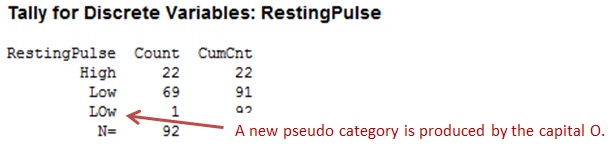
Tally can be particularly helpful if you come up against this error message when you try to run an analysis that requires binary data, such as yes/no or pass/fail.

You might encounter this when you try to run a 2 Proportions test or a binary logistic regression analysis. You're sure you have only 2 distinct values in the column, but an extra space or character, a lowercase or uppercase inconsistency, or other typo is creating another distinct value.
Tally can help you figure out the problem. For more on Tally, check out this post by Greg Fox.
3 Assign a Formula
By using conditional statements in the Minitab Calculator to create a formula, you can flag improbable observations in your worksheet.
Suppose you want to identify "suspicious" total cholesterol values that are less than 100 in column C1, which has hundreds of data values. Right-click the adjacent column (C2) and choose Formulas > Assign Formula to Column. Under Functions, select the If function. Then fill out the expression as shown below.
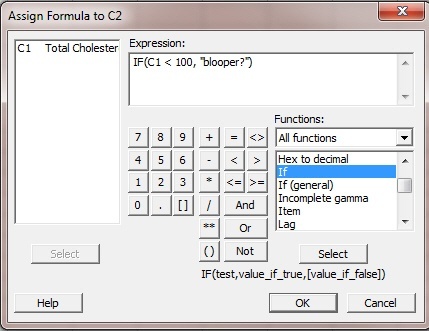
The first value in the IF function indicates the column and the condition you want Minitab to look for. The second value, after the comma, indicates the result you want to appear if the condition is met. Text values should be in double-quotations.
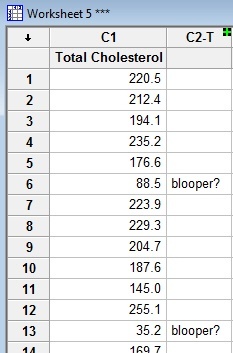
When you click OK, the formula in the adjacent column (C2) flags any value in C1 that satisfies the condition you specified—in this case, any value less than 100.
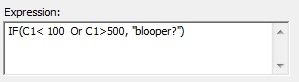
If you want to flag more than one condition, insert Or in the expression and indicate additional conditions. For example, to flag total cholesterol values that are less than 100 or greater than 500, use this expression:
Now let's take it one step further. Consider the worksheet below, which contains numerical codes for medical procedures in column C2 and the gender of each patient in column C3.

To flag simultaneuous conditions that need to be jointly satisfied, such as a certain procedure that occurs in combination with a specific gender, use And to define the expression.
For example, If VST_234 indicates a vasectomy, what blooper will this expression catch?
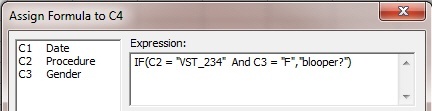
Try to find the blooper yourself in the worksheet image shown above. It isn't that easy!
Then imagine doing that for a worksheet that has data for thousands of patients and medical procedures. The effort would make your eyeballs pop right out of your head. Then you'd need medical procedure EBT_312, an eyeball transplant.
With a little luck, someone will type in the code correctly, so you won't receive a VST_234 by mistake.