by Cory Heid, guest blogger
A few months ago I posted a blog about Tootsie Pops and how many licks it takes to get to the Tootsie Roll center. If you haven’t read the post, here's a quick summary.
Recap of Initial Study
I broke down my experiment into four parts where I would test:
- the force of a lick
- temperature of a person's mouth
- pH level of a person's saliva
- the solubility of a person's saliva
After some tests and analysis of the data I collected, I was able to conclude that none of the factors I tested were statistically different or important enough to affect the number of licks required to reach the center.
I then moved to doing it the old-fashioned way and got a bunch of human lickers and recorded some data on them. The mean number of licks I found was about 356 licks, but there was a pretty large standard deviation (186 licks) and a lick range of 73 to 1087 licks.
Based on what I was able to gather, it seemed that there was a lot of variability in this experiment. Rather than trying to remove the human element from the equation, I decided to dig deeper into the Tootsie Pop itself.
And by dig deeper, I meant cutting some pops open and taking a look at them.
Plan of Attack
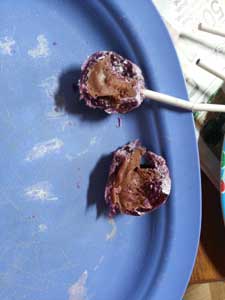
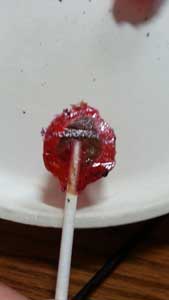
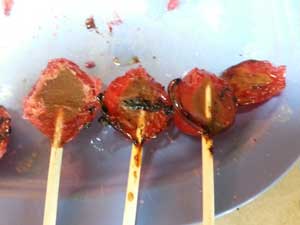
After much experimentation and testing, I finally figured out the best way to cut a tootsie pop in half. After heating a knife with a flame, I was able to chop some pops in half, and it was just like cutting butter.


As the pictures indicate, it is clear that no two pops are alike. I took a few measurements of the pop, which consisted of pop height and width, core height and width, and shell thickness on the right side. To be consistent, I decided to make my measurement point the top of the Tootsie Pop's stick. Turns out, that didn't work so well … take a look:

Since the sticks did not have a consistent length, it was hard to find the center and measure the width of the pop each time. After I found the center, I took some measurements and logged the data.
Running some basic statistics in Minitab reveals that there is pretty large variation in each of the measurement categories. Specifically, take a look at the stick length and the shell width on the right side. These two categories in particular show that there is much variation in the middle of the Tootsie Pop itself.

What Does This Mean?
People love Tootsie Pops just as they are, so we shouldn't necessarily think of this variation as a problem. But in theory, since we know that no two Tootsie Pops are the same based on the large variation in their core, we could look further into why this is and how it might be possible to "fix" this variation.
For example, since all Tootsie Pops are manufactured, we could use W. Edward Deming's work in common cause and special cause statistics to help understand where the variation in the Tootsie Pops comes from. Then, by implementing Deming's "Plan-Do-Check-Act," we could start to find and control the differences between pops.
Another possible system to help make Tootsie Pops more uniform would be Six Sigma, which was developed by Motorola in 1985. This system would help to put each pop within 6 standard deviations (hence the name Six Sigma) of the mean for pops. This system would also help reduce the defects to 3.4 defects per million.
Since the Tootsie Pop company makes about 20 million Tootsie Pops a day, that would reduce the number of inconsistent pops to 68 per 20 million pops. Not too shabby! Either system, if implemented, might help find a definitive answer for the number of licks to the center.
On the other hand, with the current system, Tootsie Pops can hold true to their longstanding answer about how many licks it takes to get to the center: "The World May Never Know!"
If you enjoyed this read or have any questions or insights, let me know in the comments below. Thanks!
About the Guest Blogger:
Cory Heid is a student in applied mathematics at Siena Heights University in Adrian, Mich. He is interested in data analysis projects, as well as data-driven model building. Cory presented his Tootsie Pop findings at the 2013 Joint Mathematics Meetings in January, and at the Michigan Undergraduate Mathematics Conference in February.


