


By Matthew Barsalou, guest blogger
Teaching process performance and capability studies is easier when actual process data is available for the student or trainee to practice with. As I have previously discussed at the Minitab Blog, a catapult can be used to generate data for a capability study. My last blog on using a catapult for this purspose was several years ago, so I would like to revisit this topic with an emphasis on interpreting the catapult study results in the Minitab Statistical Software’s Capability SixpackTM. The catapult is can be used in various configurations, but here the settings will stay constant to simulate a manufacturing process. The plans and assembly instructions are available here.
The Catapult Study
The catapult used a 120 mm diameter heavy-duty rubber band originally intended for use in model airplanes. The rubber band guide was set at 4 cm and the arm stopper was set at 1 cm. The starting point was set at 8 cm and these settings were held constant for the duration of the study. Three operators each performed 2 runs of 20 shots each to simulate two days of production with three shifts per day. Each run was used a separate subgroup in the capability and performance study.
The capability indices Cp and Cpk use short-term data to tell us what the process sis capable of doing and the performance indices Pp and Ppk use long-term data to tell us what the process is actually doing. The capability indices use “within” variation in the formula, and performance indexes use “overall” variation; within variation is based on the pooled standard deviations of the subgroups and overall variation is based on the standard deviation of the entire data set.
There are requirements that must be met to perform a capability or performance study. The data must be normally distributed and the process needs to be in a state of statistical control. The data must also be randomly selected, and it needs to represent the population. There should be at least 100 values in the data set; otherwise, there will be a very wide confidence interval for the resulting capability and performance values. The person planning the study must ensure there is sufficient data and the data represents the values in the population; however, the Capability Sixpack in Minitab Statistical Software can be used to ensure the other requirements are fulfilled.
The figure below shows a Capability Sixpack for the catapult study.
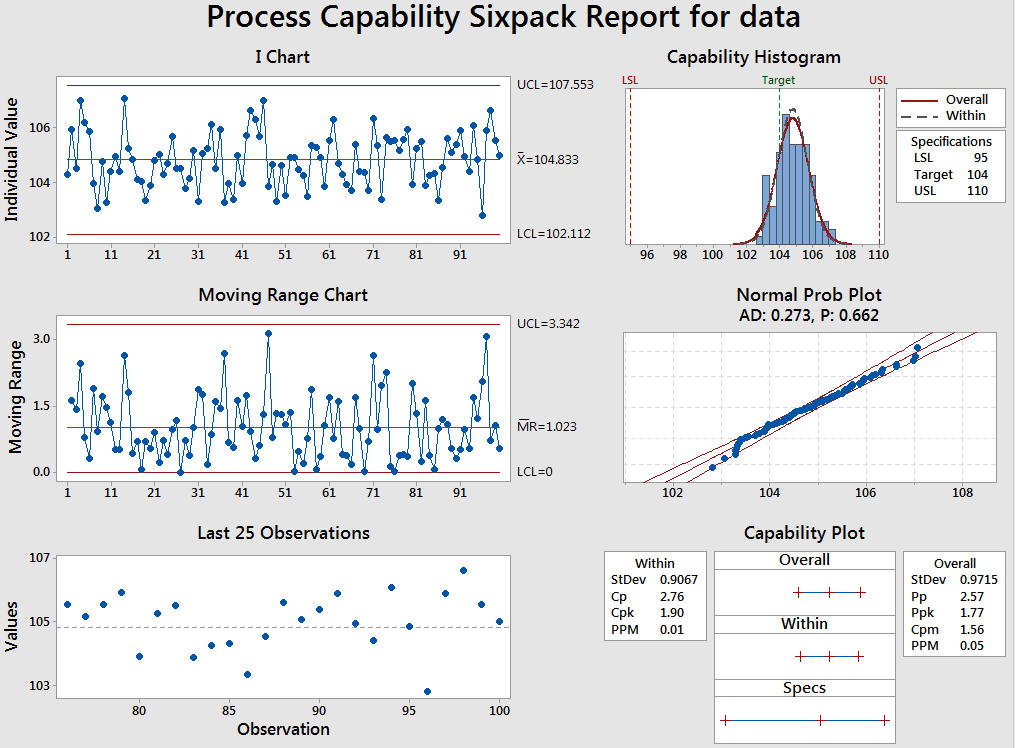
The Capability Sixpack
The Capability Sixpack provides an I chart when the data consists of individual values; i.e. the subgroup size is 1. An Xbar chart is provided when the data is entered as subgroups. Either control chart can be used to assess the stability of the process. The process will need improvement to achieve stability if out of control values are seen in a control chart. The source of the variability in the process should be sought out and removed and then the study should be repeated.
A moving range chart is given when the subgroup sizes is 1, and an S chart is given when the subgroup size is greater than 1. The values in the moving range chart should be compared to the values in the I chart to ensure no patterns are present. The same should be done for the Xbar and S chart if they are used. This is done to help ensure the data are truly random. Either the last 25 observations or the last 5 subgroups will be shown. The last 25 observations are shown if the data is entered as 1 subgroup and the last 5 subgroups are shown if the data are entered as subgroups. The values should appear random and without trends or shifts if the process is stable.
A capability histogram is shown to compare the histogram of the data to the specification limits. The data should approximate the standard normal distribution. The line for overall shows the shape of a histogram using the overall standard deviation. The within line shows the shape of the histogram using the pooled standard deviation of the subgroups.
A normal probability plot is provided to assess the normality of the data. A p-value of less than 0.05 indicates the data is not normally distributed. Data that is not normally distributed can't be used in a capability study. You may transform non-normal data, or identify and remove the cause of the lack of normality. The better option is to improve the process so that the data is normally distributed. The Capability Sixpack can’t be used if the data hits a boundary such as 0 or an upper or lower limit; however, the regular capability study option can still be used as a checkmark is placed next to the boundary indicator beside the specification limit.
The capability plot displays the capability and performance of the process. The capability of a process is measured using Cp and Cpk, and both tell us what the process is capable of. They are intended for use with short-term data and use the pooled standard deviation of rational subgroups to tell us what the process is capable of. Rational subgroups use homogenous data so that only common cause variation is present. For example, parts may have all been produced on the same machine, using the same batch of raw material, by the same operator. The Cp compares the spread of the process to the specification limits; a process with a high Cp value may produce parts out of specification if the process is off-center. The Cpk considers position of the process mean relative to specification limits and there are actually two values for Cpk, the Cpk of the upper specification limit and the Cpk of the lower specification limit. The Capability Sixpack lists the value of the worse performing of the two Cpk values.
The performance of a process is measured using Pp and Ppk with long-term data. Generally, more than 30-days' worth of production data should be used for Pp and Ppk. Unlike the capability indices Cp and Cpk, Pp and Ppk calculations are performed using the total standard deviation, which is the same as the formula for a sample standard deviation. The Pp compares the spread of the process to the upper and lower specification limits and only the worse performing value is given. The Ppk considers position of the process mean relative to specification limits.
The process capability index of the mean is the Cpm, which uses a target value to account for the process mean relative to the target. However, this is only given if a target value is entered in Minitab.
Conclusion
The Minitab Capability Sixpack will quickly and easily provide a capability study; however, it will not directly tell you if the data is unstable for a capability study. It does, however, provide methods for assessing the suitability of the data and they should be used every time a capability study is performed.
About the Guest Blogger
Matthew Barsalou is a statistical problem resolution Master Black Belt at BorgWarner Turbo Systems Engineering GmbH. He is a Smarter Solutions certified Lean Six Sigma Master Black Belt, ASQ-certified Six Sigma Black Belt, quality engineer, and quality technician, and a TÜV-certified quality manager, quality management representative, and auditor. He has a bachelor of science in industrial sciences, a master of liberal studies with emphasis in international business, and has a master of science in business administration and engineering from the Wilhelm Büchner Hochschule in Darmstadt, Germany. He is author of the books Root Cause Analysis: A Step-By-Step Guide to Using the Right Tool at the Right Time, Statistics for Six Sigma Black Belts and The ASQ Pocket Guide to Statistics for Six Sigma Black Belts.